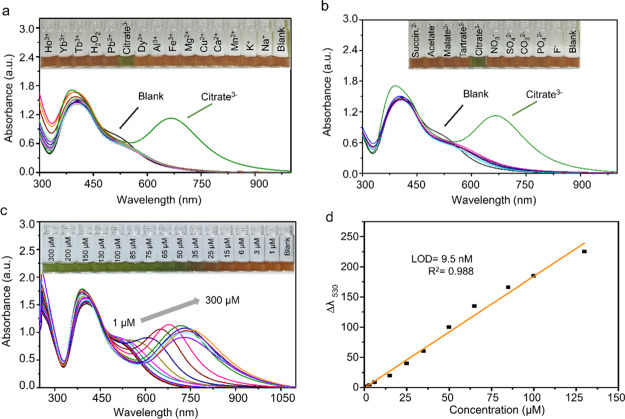
Figure 4.
UV–vis response of the dual-AgNP sensor with (a) various metal cations (the inset figure refers to color selectivity) and (b) various anions (the inset figure refers to color selectivity). (c) UV–vis response of the dual-AgNP sensor with different concentrations of citrate in tap water (the inset figure refers to the color change with citrate in the copresence of different cations and anions present in tap water) and (d) the corresponding linear calibration curve between Δλ530 and the citrate concentration (n = 3) in tap water.

