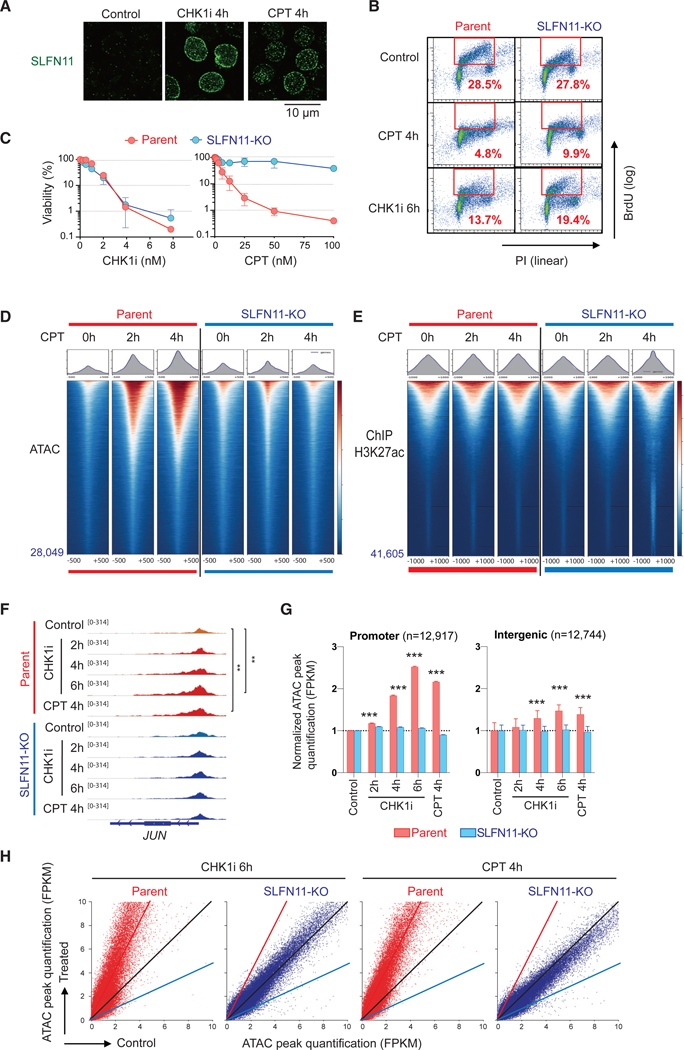
Figure 1. SLFN11 Increases Chromatin Accessibility in Response to Replication Stress Induced by TOP1 or CHK1 Inhibitors Irrespective of Subsequent Cell Fate.
(A) Immunofluorescence analyses in CCRF-CEM parental (SLFN11-positive) cells treated as indicated (no treatment control, 100 nM CHK1 inhibitor, or 100 nM CPT) for 4 h. Cells were washed with pre-extraction buffer before fixation, and only chromatin-bound SLFN11 (green) was detected by confocal microscopy.
(B) Immunofluorescence Representative flow cytometry cell cycle and replication in response to CPT (100 nM) or CHK1i (100 nM) for the indicated times in CCRF-CEM parental and isogenic SLFN11-knockout (SLFN11-KO) cells. The percentage of highly replicating cells in the red line boxes are annotated. PI, propidium iodide; BrdU, 5-bromo-2′-deoxyuridine (BrdU was added 30 min before harvest)
(C) Immunofluorescence Viability curves of CCRF-CEM parental and SLFN11-KO cells in response to CPT or CHK1i. Viability curves were determined 72 h after continuous drug treatment. Cellular ATP was used to measure cell viability with untreated cells set as 100%. Results are average of three independent experiments with ± SD.
(D) Immunofluorescence ATAC-seq results of CCRF-CEM parental and SLFN11-KO cells without or with drug treatments (no treatment [0 h], 100 nM CPT for 2 or 4 h). ATAC-seq tag densities compared in a 1,000-bp window around the summit of ATAC peaks under the indicated drug and time conditions are shown. The total number of peaks is indicated at the left bottom. Sample number is one for each condition. The data are representative of three independent experiments.
(E) Immunofluorescence ChIP-seq results using antiacetylated H3K27 antibody in CCRF-CEM parental and SLFN11-KO cells (no treatment [0 h], 100 nM CPT for 2 or 4 h). Tag density of ChIP-seq compared in a 2,000-bp window around the summit of signal peaks under the indicated drug and time conditions are shown. The total number of peaks is annotated at the left bottom. Sample number is one for each condition.
(F–H) ATAC-seq results of CCRF-CEM parental and SLFN11-KO cells without or with drug treatments (no treatment [control], 100 nM CPT for 4 h, and 100 nM CHK1 inhibitor for 2, 4, or 6 h) in parallel. Sample number is one for each condition.
(F) Immunofluorescence IGV sequencing tracks for the JUN locus. Signal in promoters of untreated and treated samples were compared using the Poisson test, which is similarly applied by MACS for peak calling (Zhang et al., 2008). **p ≤ 0.01.
(G) Immunofluorescence Bar graphs representing ATAC peak quantification (fragments per kilobase million [FPKM]) at promoter and intergenic regions (mean ± SEM). The number of ATAC peaks of each region is shown in parentheses. ***p ≤ 0.001.
(H) Immunofluorescence Dot plots representing basal ATAC peak quantification (x axis) and after drug treatment (y axis). Each point represents a single ATAC peak in each of the 2 conditions. The black, red, and blue lines indicate no difference, 2-fold increase, and 2-fold decrease, respectively. CPT: camptothecin; CHK1i, prexasertib.
See also Figure S1.

