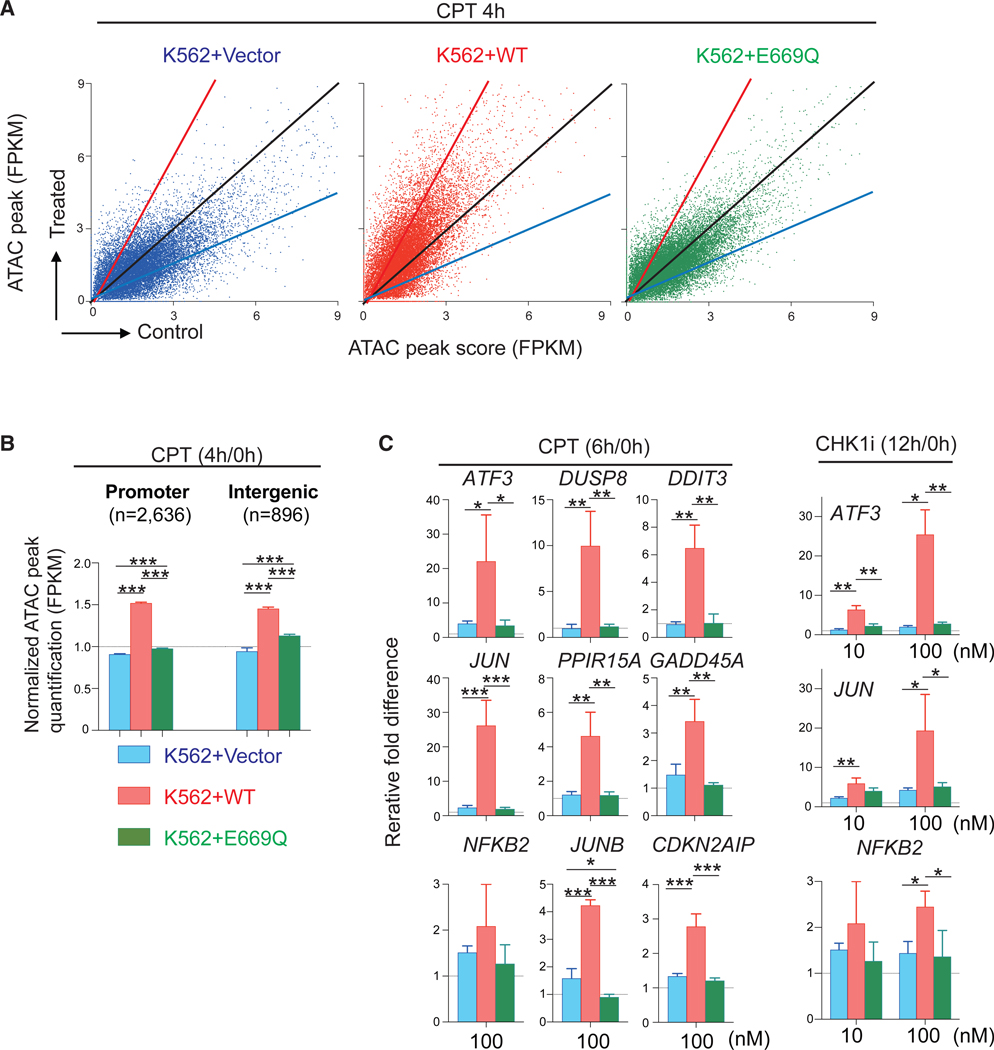
Figure 3. The ATPase Walker-B Sequence of SLFN11 Is Required for the Global Chromatin Accessibility and Selective IEG Induction by SLFN11.
(A and B) ATAC-seq results of human leukemia K562+Vector, +WT (wild-type SLFN11) and +E669Q (putative ATPase-dead SLFN11) (Murai et al., 2018) without or with drug treatments (no treatment [control], 1,000 nM CPT treatment for 4 h). (A) Dot plots representing ATAC peak quantification (x axis) before and after CPT treatment (y axis). Each dot corresponds to a single ATAC peak (n = 18,088; note that 189, 239, and 212 data points are outside the axis limits for K562+Vector, +WT, and +E669Q, respectively). (B) Bar graphs representing ATAC peak quantification (FPKM) at promoter and intergenic regions (mean ± SEM). The number of ATAC peak of each region is shown in parentheses. ***p ≤ 0.001.
(C) Bar graphs of qRT-PCR for the indicated genes and treatments (250 nM CPT, 10 nM CHK1i, or 100 nM CHK1i) in K562-Vector, -WT, -E669Q cells. Each transcript was normalized to the expression level of 18S RNA. Results are the average of three independent experiments with ± SD. *p ≤ 0.05, **p ≤ 0.01, ***p ≤ 0.001 (two-tailed unpaired t test). See also Table S5.

