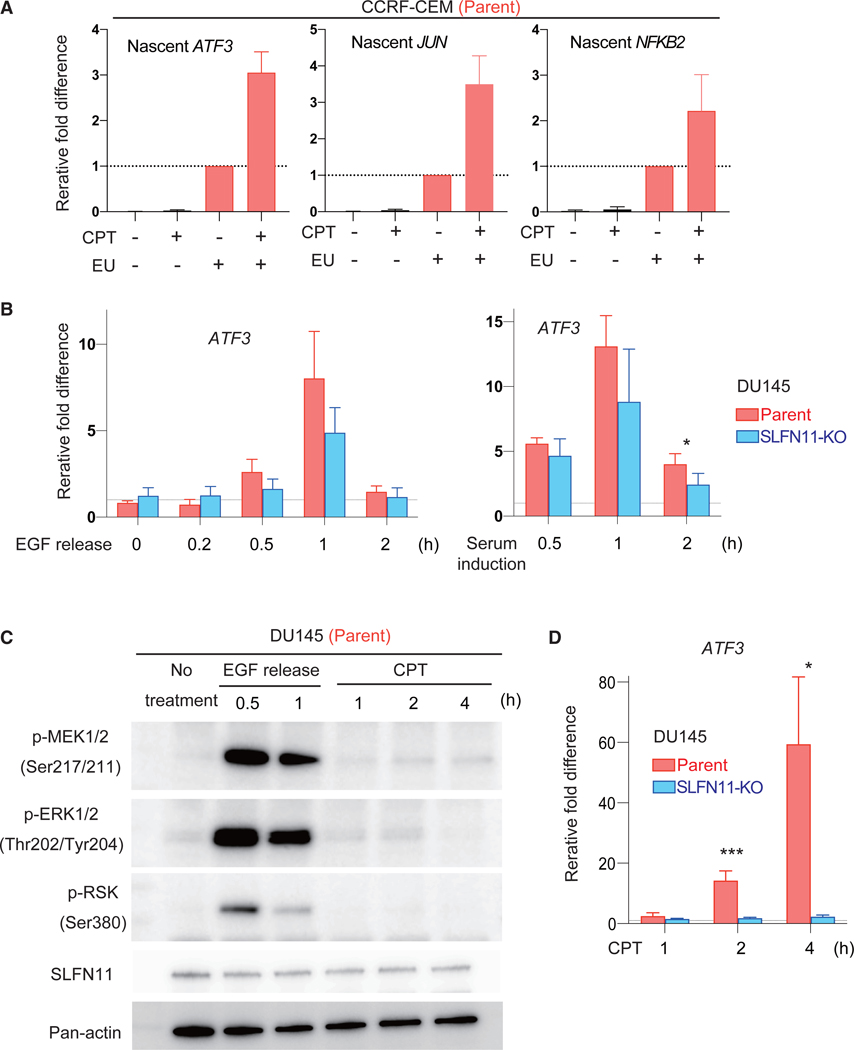
Figure 4. SLFN11-Mediated Transcription Activation Occurs in a Different Pathway from Canonical External Stimuli.
(A) Bar graphs of qRT-PCR for the nascent transcripts of the indicated genes without or with CPT (100 nM for 4 h) treatment. CCRF-CEM parental and SLFN11-KO cells were labeled with or without EU (ethynyl uridine). Each transcript was normalized to the expression level of total 18S RNA from the RNA samples before enrichment of nascent RNA. Results are the average of three independent experiments with ± SD.
(B) Bar graphs of qRT-PCR for the ATF3 gene and for the indicated times in DU145 parental and SLFN11-KO cells. Cells were incubated with epithelial growth factor (EGF) (25 ng/ml) for 10 min and released into regular medium (left). Serum induction was performed after 40 h of serum starvation (right). Each transcript was normalized to the expression of 18S RNA. Results are the average of three independent experiments with ± SD (left) or representative of two independent experiments with average ± SD (n = 3) (right). *p ≤ 0.05, (two-tailed unpaired t test).
(C) Western blots with the indicated antibodies and conditions in DU145 parental cells. Cells were incubated with CPT (100 nM) continuously or with EGF (25 ng/ml) for 10 min and released in regular medium.
(D) Bar graphs of qRT-PCR for the ATF3 gene for the indicated times in DU145 parental and SLFN11-KO cells. Cells were incubated with CPT (100 nM) continuously. Each transcript was normalized to the expression of 18S RNA. Results are average of three independent experiments with ± SD. *p ≤ 0.05, ***p ≤ 0.001 (two-tailed unpaired t test).
See also Figures S2 and S3 and Table S5.

