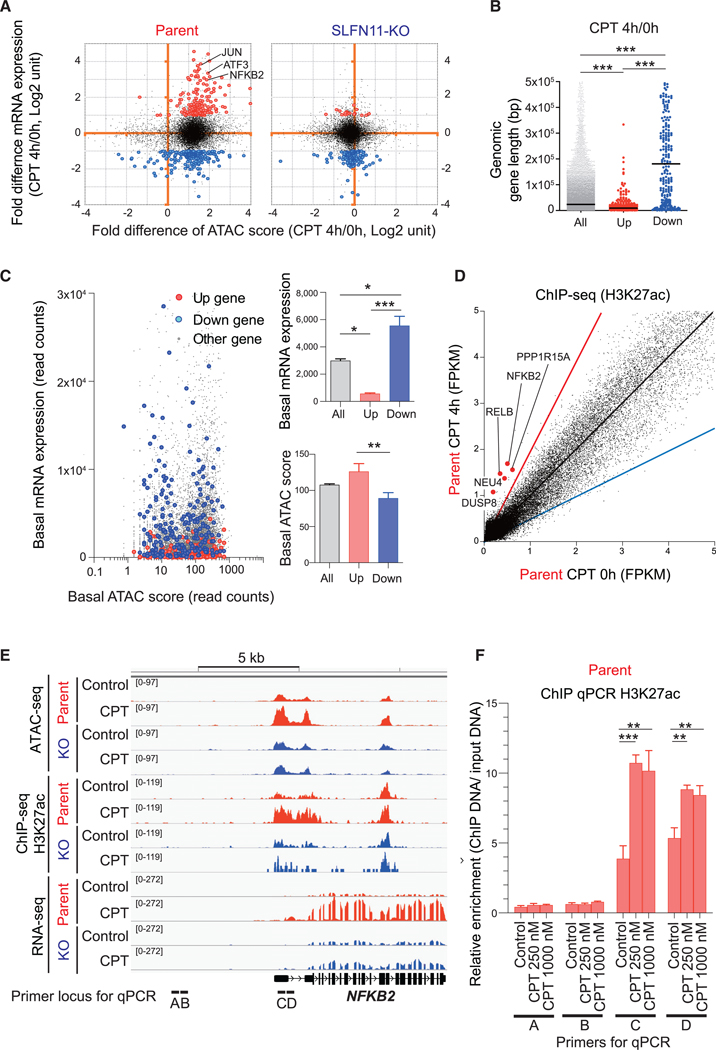
Figure 6. Features of the Genes Activated by SLFN11 in Response to Replication Stress.
(A–C) Compilation of the ATAC-seq data (Figure 1) and the RNA-seq data (Figure 2). (A) Dot blots represent the fold difference of mRNA expression (CPT 4 h/0 h) (y axis) and fold difference of ATAC-seq score (CPT 4 h/0 h) (x axis) in CCRF-CEM parent (left) and SLFN11-KO cells (right). Three representative IEGs are annotated. Upregulated (>2-fold and p < 1E-07) and downregulated (< −2-fold and p < 1E-07) genes are colored in red and blue, respectively. (B) Dot blots representing gene length (bp) of the upregulated (up) and downregulated (down) genes compared to all genes (all). (C) Dot blots representing basal mRNA expression level (y axis) and basal ATAC-seq score (x axis) for each gene (left). Each parameter is replotted on the right panels for all the upregulated (up) and downregulated (down) genes.
(D) Dot plots representing H3K27 acetylation levels in basal condition (x axis) and after drug treatment (CPT 100 nM for 4 h, y axis). Each point represents the intensity of ChIP-seq peaks of the 2 conditions. The black, red, and blue lines indicate no difference, 2-fold increase, and 2-fold decrease, respectively. The hyperacetylated IEGs (>2-fold) at their promoters are annotated and highlighted in red.
(E) Sequencing tracks around the NFKB2 locus for the indicated conditions in CCRF-CEM parent and SLFN11-KO.
(F) Enrichment of the active histone mark H3K27Ac around the NFKB2 locus was examined by ChIP assay in CCRF-CEM parental cells with or without CPT treatment (250 nM or 1,000 nM, 4 h). The loci of primer sets for ChIP qPCR are shown at the bottom of (E). Results are representative of three independent experiments and the average of three technical repeats with ± SD. **p ≤ 0.01, ***p ≤ 0.001 (two-tailed unpaired t test).

