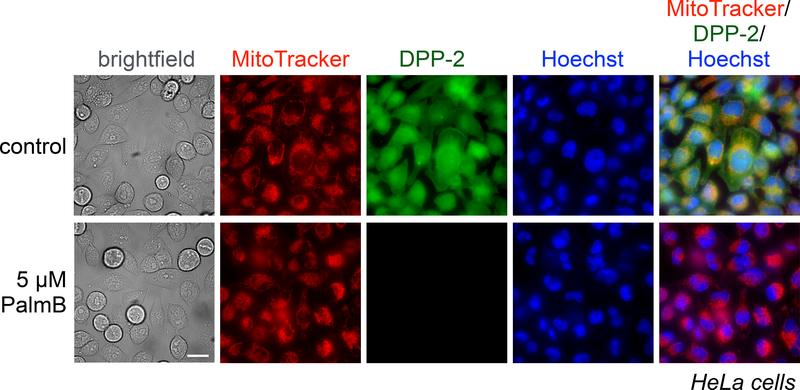
Figure 4.
HeLa cells treated for 30 min with 1 μM Hoechst 33342, 100 nM MitoTracker Deep Red, and either DMSO or 5 μM PalmB, washed, loaded with 1 μM DPP-2 for 15 min, and then analyzed by epifluorescence microscopy. Representative images for brightfield, MitoTracker, DPP-2, Hoechst 33342 nuclear stain, and an overlay of MitoTracker, DPP-2, and Hoechst 33342 are shown for each set of conditions. 25 μm scale bar shown.

