
FIGURE 4.
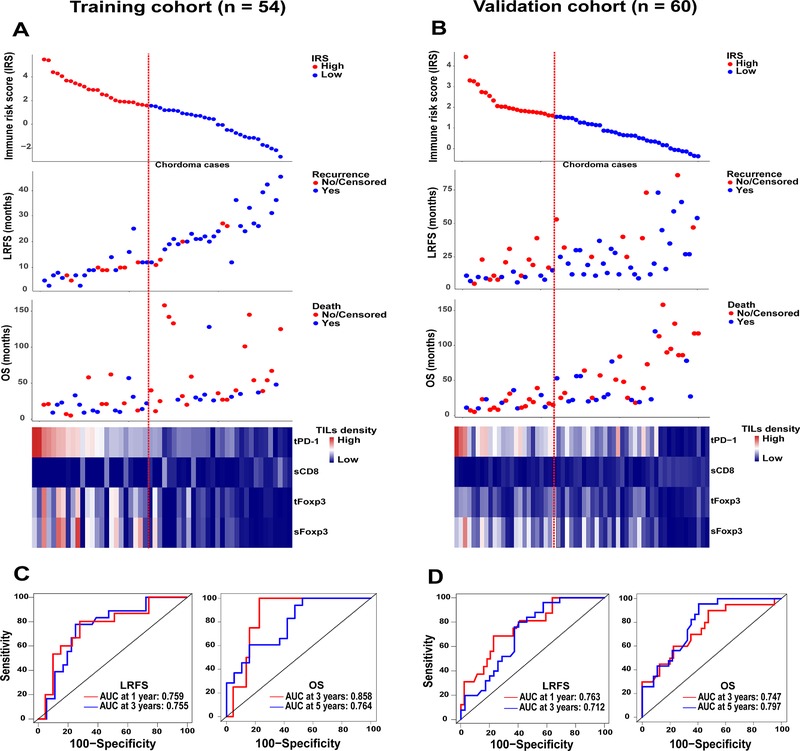
Distribution of IRS, recurrence status, and survival status among the training (A) and validation (B) chordoma samples. The heatmap (bottom) shows the profile of four immune features included for the IRS construction in chordoma patients. Columns represent patients who were sorted descendingly by their IRS levels. Red dotted line represents the IRS cutoff dividing patients into high and low subgroups. B, Receiver operating characteristics curves show the sensitivity and specificity for the IRS (as a continuous variable) in predicting LRFS and OS of patients from the training (C) and validation (D) cohort.
Abbreviations: AUC, area under the curve; IRS, immune risk score; LRFS, local recurrence‐free survival; OS, overall survival; sCD8, stromal CD8+ TILs; sFoxp3, stromal Foxp3+ TILs; tFoxp3, tumor Foxp3+ TILs; TILs, tumor‐infiltrating lymphocytes; tPD‐1, tumor PD‐1+ TILs.