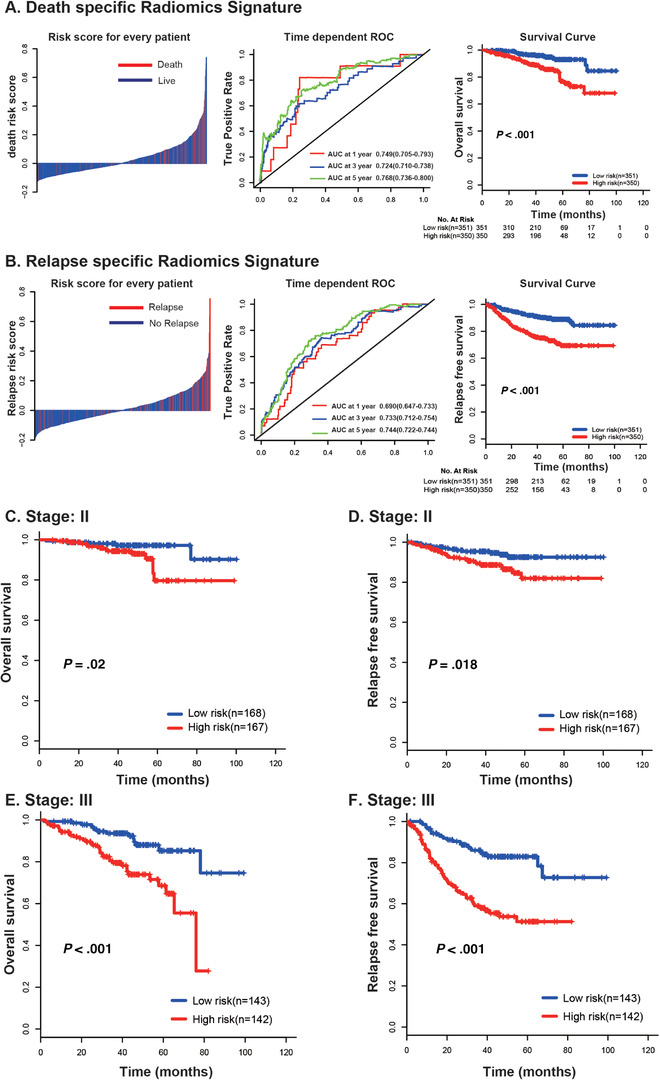
FIGURE 1.

Distribution of radiomics risk score, time‐dependent relative operating characteristiccurves at 1, 3, and 5 years, and Kaplan‐Meier survival curves of patients at low and high risk of death (A) and relapse (B). Stratified Kaplan‐Meier survival analysis of death and relapse signatures based on tumor stage. (C) Death signature in stage II; (D) relapse signature in stage II; (E) death signature in stage III; (F) relapse signature in stage III
