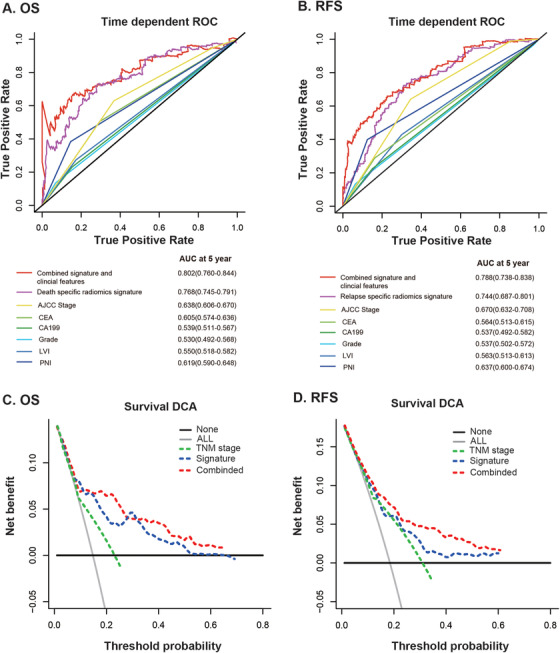
FIGURE 2.

Time‐dependent relative operating characteristic curves at 5 years compare the prognostic accuracy in predicting OS (A) and RFS (B) of radiomics signatures with clinicopathological features including American Joint Commission on Cancer (AJCC) tumor stage, grade, CEA status, CA19_9 status, Lymphatic vascular invasion (LVI), and Peripheral nervous invasion (PNI). Decision curve analysis at 5 years of OS (C) and RFS (D) for the radiomics signature, tumor stage, and the two combined model. The y‐axis measures the net benefit.
