
FIGURE 3.
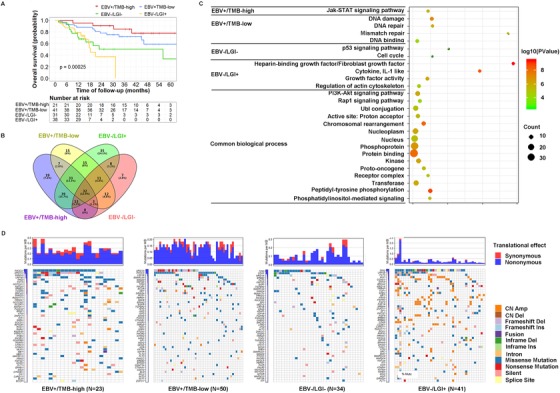
The four‐subtype classification system of gastric cancer by EBV status combined with TMB and LGI. A, Kaplan‐Meier survival curve for the four‐subtype classification system and overall survival. B, Venny plot for the four‐subtype classification system. C, Pathways in each subtype. D, Top 50 genes in each subtype