
FIGURE 6.
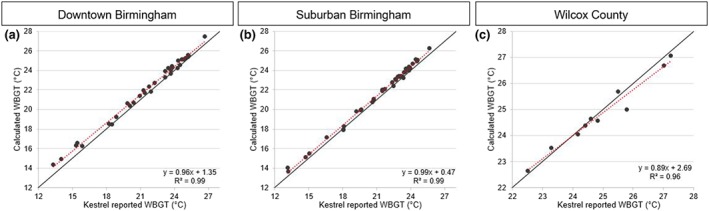
Linear regressions of Kestrel reported WBGT vs. calculated WBGT based on daily averages. Black solid lines represent a 1/1 slope.
Official websites use .gov
A
.gov website belongs to an official
government organization in the United States.
Secure .gov websites use HTTPS
A lock (
) or https:// means you've safely
connected to the .gov website. Share sensitive
information only on official, secure websites.
Linear regressions of Kestrel reported WBGT vs. calculated WBGT based on daily averages. Black solid lines represent a 1/1 slope.