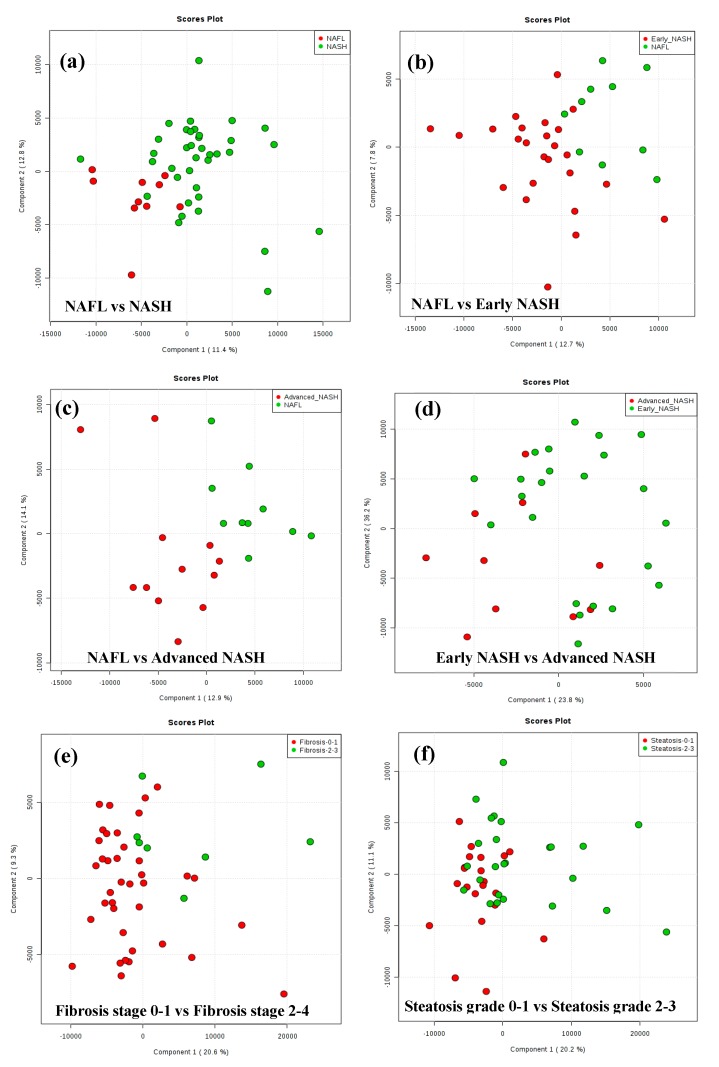
Figure 1.
The results of PLS-DA analysis of metabolite levels derived from MS are shown as score plots. Each red or green point in the score plot represents one patient. In these plots, points (known as scores) for patients that exhibit similar metabolite profiles will appear closer to each other and vice versa. The score plots show good clustering and separation of the patients with (a) nonalcoholic fatty liver (NAFL) vs. NASH; (b) NAFL vs. early NASH; (c) NAFL vs. advanced NASH; (d) Early NASH vs. advanced NASH; (e) Fibrosis stage 0–1 vs. Fibrosis stage 2–4; and (f) Steatosis grade 0–1 vs. Steatosis grade 2–3.

