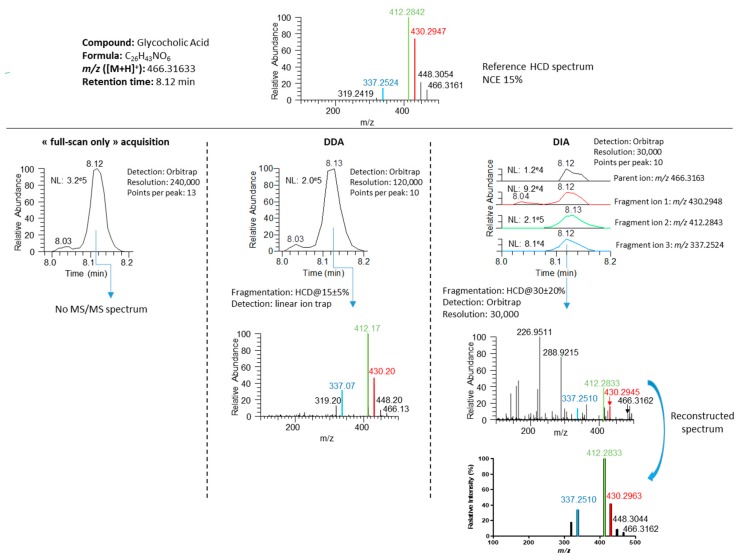
Figure 5.
MS and MS/MS data of glycocholic acid obtained with full-scan only, DDA and DIA workflows. The reference MS/MS spectrum was acquired at an NCE of 15% while DDA and DIA acquisitions used NCEs of 15% ± 10% and 30% ± 20%, respectively. DIA MS/MS spectrum of glycocholic acid was manually reconstructed from relative fragment ion intensities.

