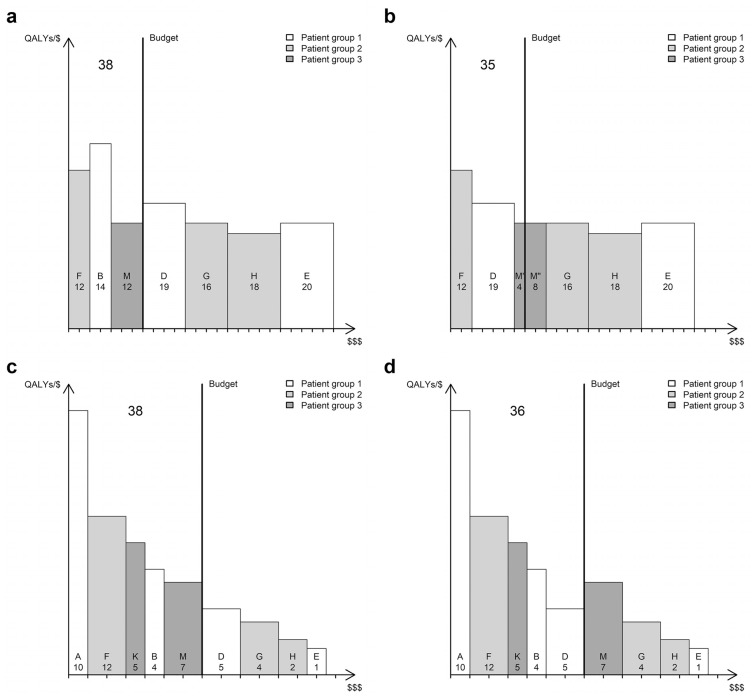
Figure 2.
Bookshelf illustrations of a health care system where interventions within a patient group are mutually exclusive. The height and width of a book represents (a, b) average cost-effectiveness and total cost or (c, d) incremental cost-effectiveness and incremental cost. Bookshelves to the left (a and c) depict the reference scenario where the system remains unchanged; bookshelves to the right (b and d) depict the scenario where intervention D is included in the system. A tick on the horizontal axis represents $100,000 in total spending. Numbers represent thousands of quality-adjusted life years (QALYs) produced by the individual interventions (small) and the health care system in total (big).

