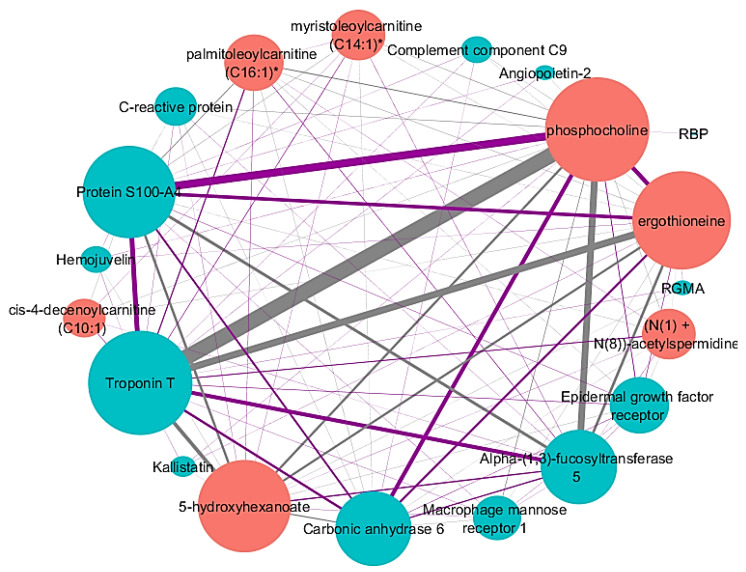
Figure 1.
Identified network after applying sparse multiple canonical correlation network (SmCCNet) to adjusted proteomic and metabolomic data and FEV1%. Proteins are blue nodes and metabolites are red nodes. Grey edges represent a negative correlation between the nodes. Purple edges represent a positive correlation between the nodes. Edge thickness corresponds to the relationships between the nodes based on the canonical weights. Node size corresponds with connectivity. Abbreviations: retinol-binding protein (RBP), repulsive guidance molecule A (RGMA). * Indicates a compound that has not been confirmed based on a standard, but Metabolon is confident in its identity.

