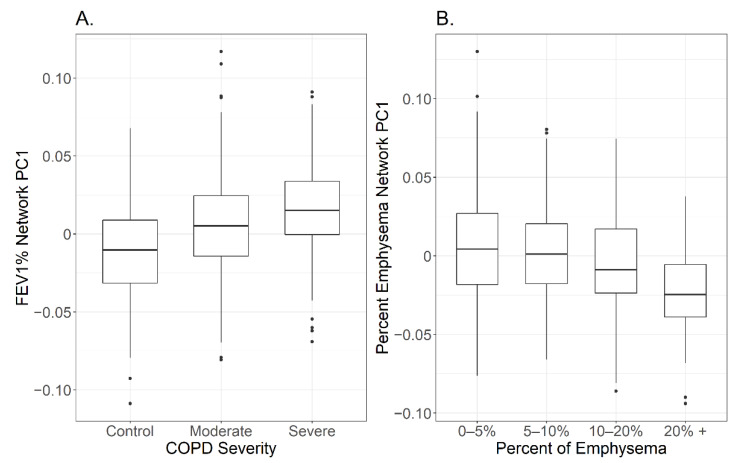
Figure 3.
Trends of network first principal component (PC1) with disease severity. Trends within the network associated with FEV1% were analyzed by dividing subjects into control, moderate COPD (Gold = 1 or 2), and severe COPD (GOLD = 3 or 4) groups. There were significance differences between all three groups (p-value < 0.005), with higher PC1 in the severe COPD group versus the moderate COPD group versus the control (A). Subjects were also divided by emphysema severity to analyze trends within the network associated with percent emphysema (B). Only subjects that had more than 20% emphysema had a significantly different PC1 than the other three groups (p-value = 0.00066).

