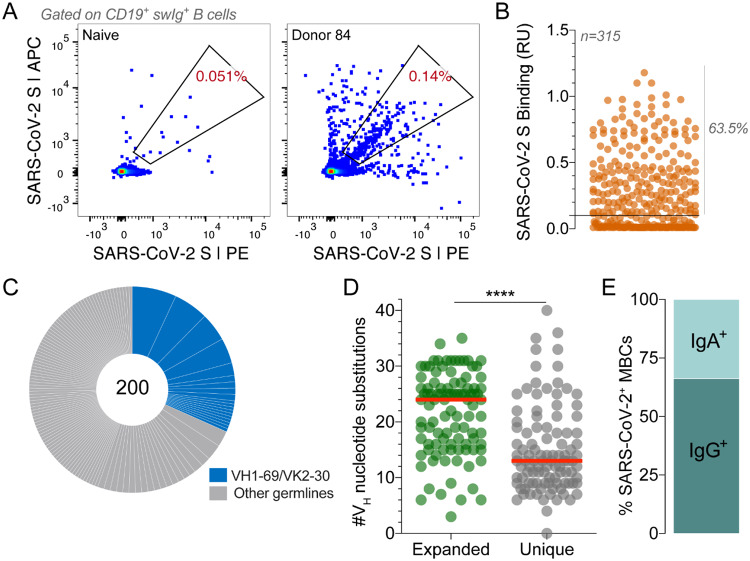
Figure 1.
Isolation of SARS-CoV-2 S-specific IgGs. (A) Frequency of SARS-CoV-2 S-reactive B cells in Donor 84 and a negative control SARS-CoV-naïve donor. Fluorescence activated cell sorting (FACS) plots shown are gated on CD19+CD20+IgD−IgM− B cells. SARS-CoV-2 S was labeled with two different colors to reduce background binding. The percentage shown in the gate indicates the frequency of SARS-CoV-2 S-reactive B cells among CD19+CD20+IgD−IgM− B cells. (B) Binding of 315 isolated antibodies to SARS-CoV-2 S, as determined by biolayer interferometry (BLI). The solid line indicates the threshold used for designating binders (0.1 RUs). (C) Clonal lineage analysis. Each lineage is represented as a segment proportional to the lineage size. Clones that that utilize VH1–69/VK2–30 germline gene pairing are shown in blue. The total number of isolated antibodies is shown in the center of the pie. Clonal lineages were defined based on the following criteria: identical VH and VL germline genes, identical CDR H3 length, and CDR H3 amino acid identity ≥80%. (D) Load of somatic mutations, expressed as number of nucleotide substitutions in VH, in unique antibodies and members of expanded clonal lineages. (E) Proportion of SARS-CoV-2 S binding antibodies derived from IgG+ and IgA+ B cells, as determined by index sorting. Statistical comparisons were made using the Mann-Whitney test (**** P < 0.0001). Red bars indicate medians. swIg, switched immunoglobulin; RU, response units; VH, variable region of the heavy chain.

