Figure 2.
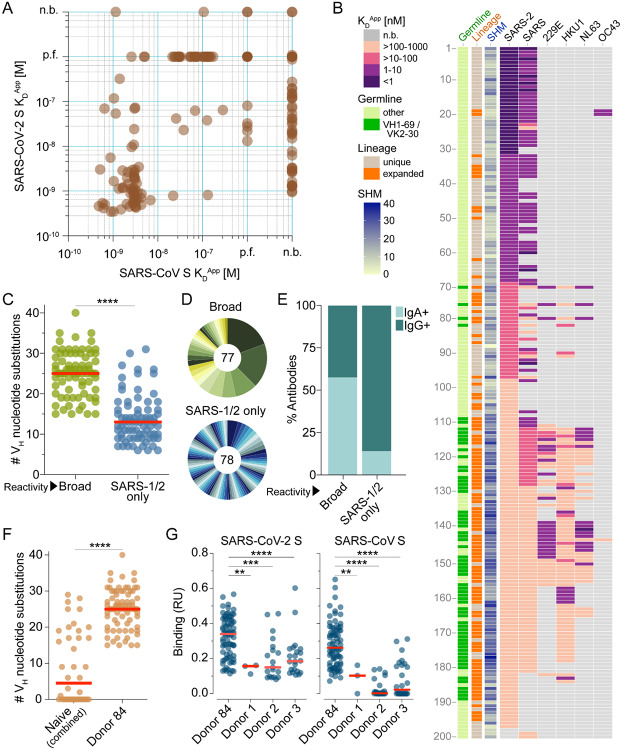
Binding properties of SARS-CoV-2 S-specific antibodies. (A) Apparent binding affinities of SARS-CoV-2 S-specific IgGs for prefusion-stabilized SARS-CoV and SARS-CoV-2 S proteins, as determined by BLI measurements. Low affinity clones for which binding curves could not be fit are designated as “poor fit” on the plot. (B) Apparent binding affinities of the isolated antibodies for SARS-CoV-2, SARS-CoV, 229E, HKU1, NL63, and OC43 S proteins. Germline gene usage, clonal expansion, and SHM are indicated in the three leftmost panels. SHM is represented as the number of nucleotide substitutions in VH. (C) Load of somatic mutations in broadly cross-reactive and SARS-CoV/SARS-CoV-2-specific antibodies. Red bars indicate medians. (D) Degree of clonal expansion in broadly cross-reactive and SARS-CoV/SARS-CoV-2-specific antibodies. Each lineage is represented as a segment proportional to the lineage size. The total number of antibodies is shown in the center of the pie. (E) Proportion of broadly cross-reactive and SARS-CoV/SARS-CoV-2-specific antibodies derived from IgG+ and IgA+ B cells, as determined by index sorting. (F) Load of somatic mutations in SARS-CoV-2 S-reactive antibodies isolated from three naive donors and Donor 84. Antibodies from naïve donors were combined for this analysis. (G) Binding activity of antibodies isolated from Donor 84 and three naïve donors to SARS-CoV and SARS-CoV-2 S, as determined by BLI. p.f., poor fit; n.b., non-binder; RU, response units. Statistical comparisons were made using the Mann-Whitney test (** P < 0.01; *** P < 0.001; **** P < 0.0001).

