Figure 3.
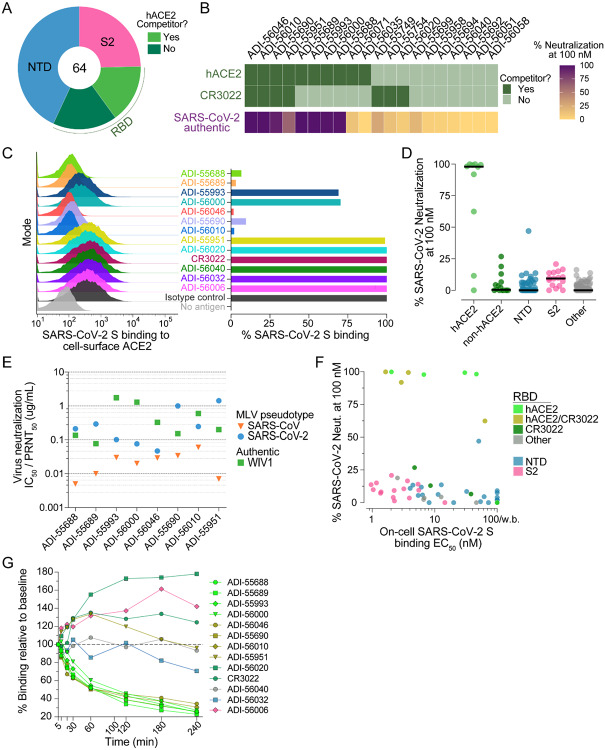
Epitope mapping and neutralization screening. (A) Proportion of SARS-CoV-2 S-specific antibodies targeting each of the indicated antigenic sites. (B) Heat map showing the competitive binding profiles of the RBD-directed antibodies (top) and percent neutralization of authentic SARS-CoV-2 at a 100 nM concentration (bottom). (C) Antibody inhibition of SARS-CoV-2 S binding to endogenous ACE2 expressed on Vero E6 cells, as determined by flow cytometry. Antibodies were mixed with recombinant SARS-CoV-2 S expressing a Twin-Strep-tag at a molar ratio of 5:1 before adding to Vero E6 cells. Strep-Tactin-PE was used to detect the relative intensity of SARS-CoV-2 S binding to cell-surface ACE2. An anti-ebolavirus antibody (KZ52) was used as an isotype control. The “no antigen” control shown in the right panel indicates secondary-only staining. Percent binding shown in the right panel was normalized to isotype control. (D) Percent authentic SARS-CoV-2 neutralization observed in the presence of 100 nM antibody. Antibodies are grouped according to epitope specificity. RBD-directed antibodies that compete or do not compete with ACE2 are designed as ACE2 and non-ACE2, respectively. (E) Antibody neutralization of SARS-CoV and SARS-CoV-2 MLV pseudovirus (strain n-CoV/USA_WA1/2020) using HeLa-ACE2 target cells, and antibody neutralization of authentic WIV1-CoV using Vero E6 target cells. SARS-CoV and SARS-CoV-2 IC50s and WIV1-CoV PRNT50s are reported in μg/ml. (F) Binding EC50s for cell-surface SARS-CoV-2 S are plotted against percent neutralization of authentic SARS-CoV-2 at 100 nM. Background binding was assessed using mock transfected HEK293 cells. Data points are colored according to epitope specificity. RBD-directed antibodies are further categorized based on their competition group: hACE2, antibodies that only compete with hACE2; CR3022, antibodies that only compete with CR3022; hACE2/CR3022, antibodies that compete with hACE2 and CR3022; Other, antibodies that do not compete with hACE2 or CR3022. (G) Antibody binding activity to cell-surface SARS-CoV-2 S over time, as determined by flow cytometry. IgGs were incubated with cells expressing WT SARS-CoV-2 at 37°C and aliquots were placed on ice at the indicated time points. Binding MFI was assessed at 240 min for all samples. CR3022 is included for comparison. Curves are colored by epitope specificity, as in (F).

