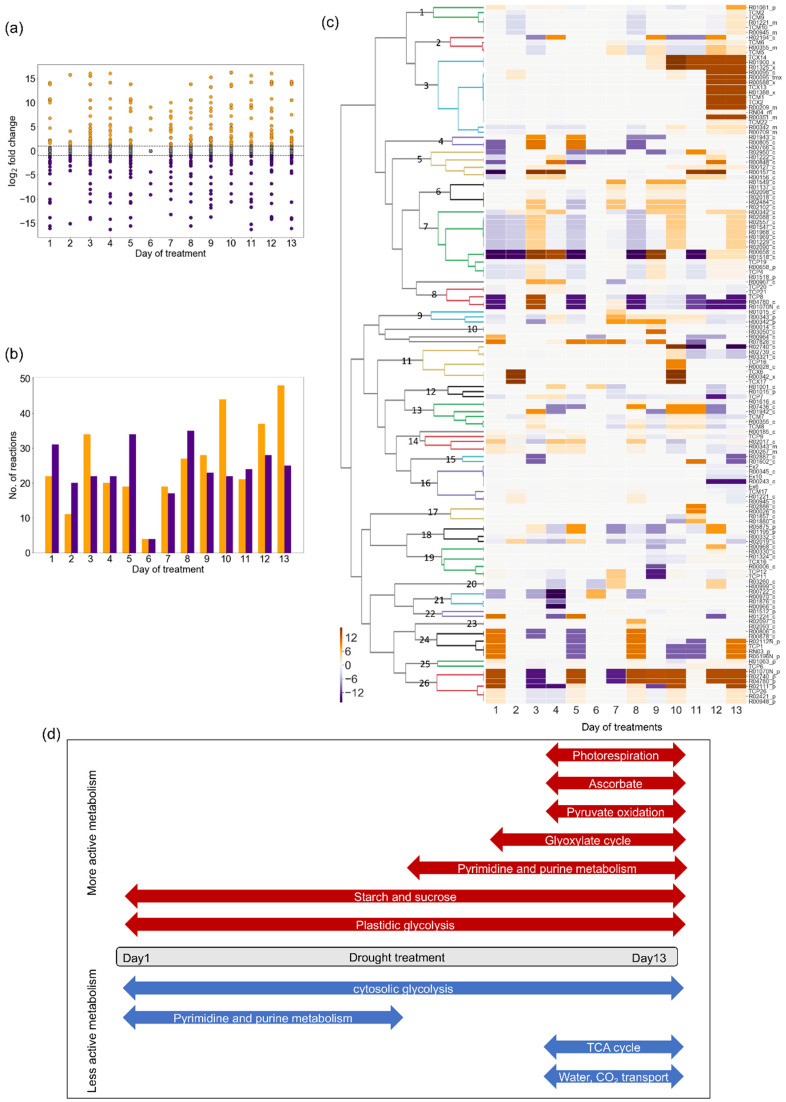
Figure 6.
Changes in flux distribution: In the figures, fold-change (drought/control) value was transformed into logarithm to base 2 for clarity. (a) Distribution of log2(fold-change) values and (b) number of reactions showing fold-change values greater than two or less than half (namely, |log2(fold-change)| > 1). In Figure 6a,b, orange and purple indicate increased and decreased flux under drought, respectively. (c) Clustering analysis of reactions showing fold-change values greater than two or less than half at least one time point. (d) Summary of metabolic change during progressive drought stress.

