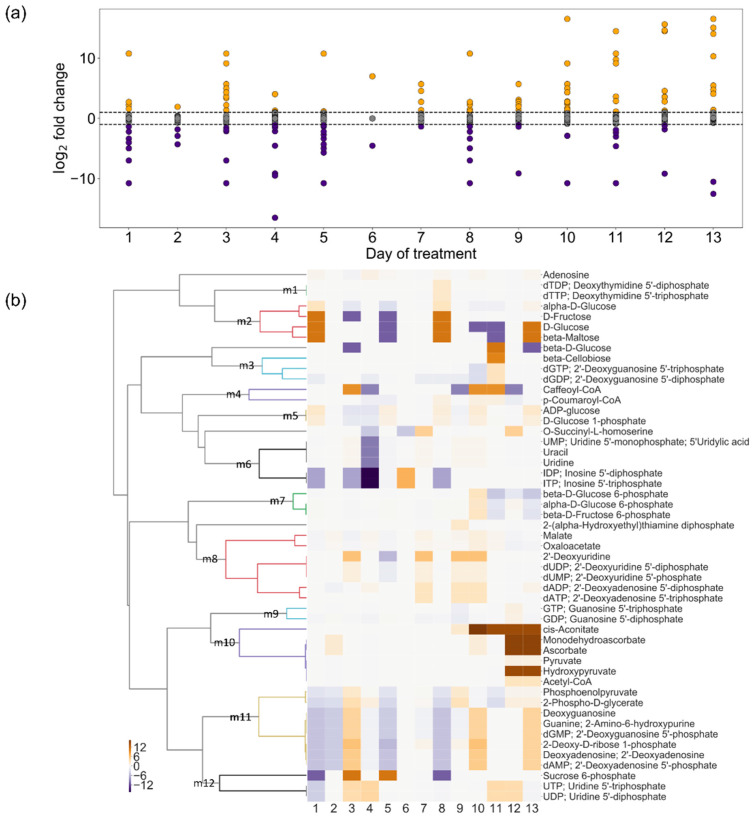
Figure 7.
Changes in flux-sum: In the figures, the fold-change (drought/control) value was transformed into logarithm to base 2 for clarity. (a) Distribution of log2(fold-change) values: Orange and purple dots represent the metabolites with fold-change values greater than two or less than one- half, respectively. (b) Cluster analysis of the metabolites with fold-change values greater than two or less than half for at least one time point.

