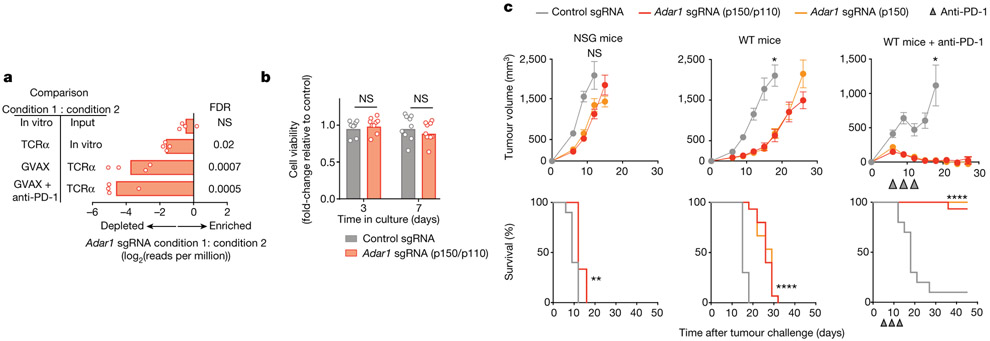
Fig. 1 ∣. Loss of ADAR1 in tumour cells enhances anti-tumour immunity and responses to PD-1 checkpoint blockade.
a, Relative depletion of Adar1 sgRNAs from a pool of sgRNAs targeting 2,368 genes expressed by Cas9+ B16 tumour cells. n = 4 independent guides targeting each gene; false discovery rate (FDR) was calculated using the STARS algorithm v1.3 to generate permutation testing and a null distribution. b, Viability of Adar1-null and control B16 tumour cells following in vitro culture. n = 9 for each condition; results are representative of two independent experiments. c, Tumour volume and survival analysis of control (grey), Adar1 p150-null (orange) or Adar1 p110/p150-null (red) B16 tumours in NSG, wild-type (WT) and wild-type anti-PD-1-treated C57BL/6 mice. Wild-type B16 mice that did not receive anti-PD-1 treatment were treated with an equivalent concentration of rat IgG2a isotype control antibody. Data in c represent two independent experiments with n= 5 animals per guide with two separate guides for the control group and three separate guides for each Adar1-null group. Data for individual guides targeting each isoform of ADAR1 are pooled. a, b, Bars show mean; c, mean ± s.e.m. b, c (tumour volume curves), two-sided Student’s t-test; c (survival curves), log-rank test;*P < 0.05; **P < 0.01; ****P < 0.0001; NS, not significant.

