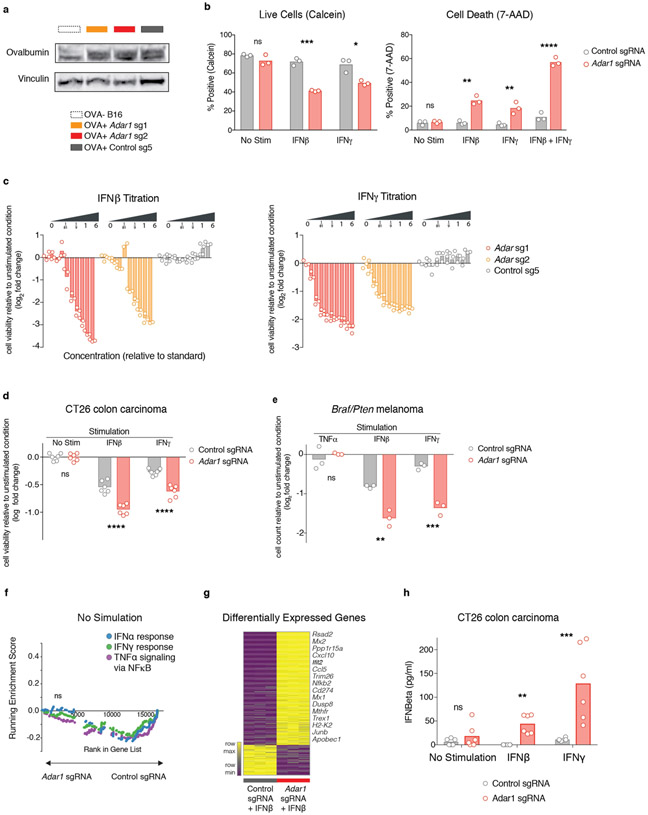
Extended Data Fig. 5 ∣. Further studies corroborating the reported in vitro phenotype of Adar1-null tumour cells.
a, Western blot demonstrating expression of ovalbumin in modified Adar1 p150/p110-null (red), Adar1 p150-null (orange) and control (grey) B16 tumour cell lines. Data are representative of two independent experiments. b, Calcein cell viability and 7-AAD cell death staining of control or Adar1-null B16 tumour cells following stimulation with IFNβ, IFNγ or a combination of both. Data are representative of three independent experiments with n = 3 for each condition. c, Growth and viability of Adar1 p150/p110-null, Adar1 p150-null and control B16 tumour cells in response to increasing doses of IFNβ and IFNγ (n = 3 for each condition). Doses are relative to 1 × standard of 1,000 U ml−1 IFNβ and 100 ng ml−1 IFNγ. Data are representative of two independent experiments. d, Growth and viability of Adar1 p150/p110-null and control CT26 tumour cells following stimulation with IFNβ or IFNγ relative to the unstimulated state (n = 3 for each condition). Data are representative of two independent experiments. e, Growth and viability of Adar1 p150/p110-null and control Braf/Pten tumour cells following stimulation with TNF, IFNβ or IFNγ relative to the unstimulated state (n = 3 for each condition). Data are representative of two independent experiments. f, GSEA of gene signatures in Adar1-null compared with control B16 tumours cells after in vitro culture without cytokine stimulation. n = 3 for each condition; FDR calculated using GSEA. g, Heat map showing differentially expressed genes from Adar1-null and control B16 tumour cells 36 h after IFNβ stimulation in vitro (n = 3 for each condition). Genes listed in adjacent text were manually curated as antiviral or relevant to anti-tumour immunity. h, IFNβ ELISA of control and Adar1 p150/p110 CT26 tumour cells following stimulation with IFNβ or IFNγ (n = 3 for each condition). b–e, h, Two-sided Student’s t-test, *P < 0.05; **P < 0.01; ***P < 0.001; ****P < 0.0001.

