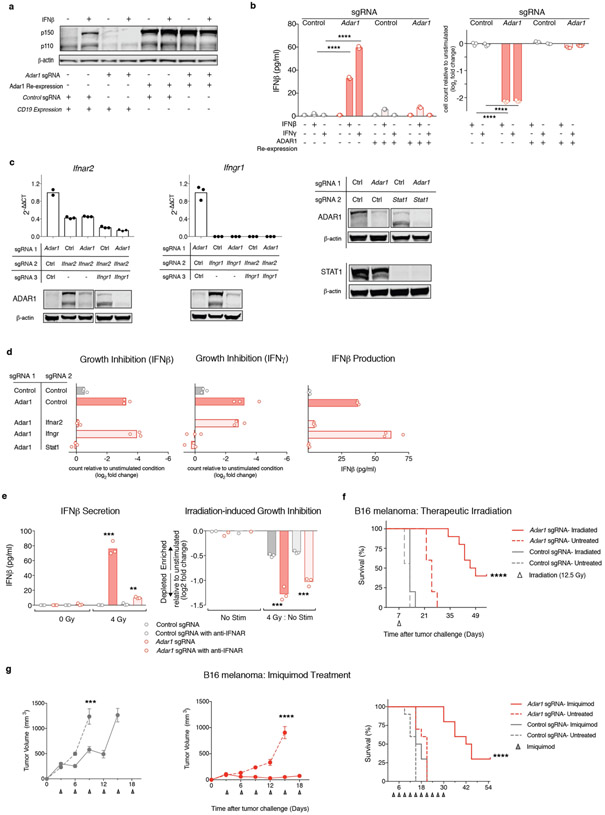
Extended Data Fig. 6∣. ADAR1 re-expression and corroborating in vitro epistatic IFN-signalling experiments.
a, Western blot of B16 Adar1-null tumour cells following re-expression of wild-type ADAR1 or an irrelevant control (CD19) protein. Data are representative of two independent experiments. b, IFNβ secretion (left) and relative growth (right) of control (grey), Adar1 p150/p110-null (red), Adar1-null with full-length ADAR1 re-expression construct (red outline) and control with ADAR1 re-expression construct (grey outline) B16 tumour cells following cytokine stimulation as indicated (n = 3 for each condition). Data are representative of two independent experiments. c, qPCR and western blot validation of the loss of expression of Ifnar2, Ifngr1 and Stat1 from B16 tumour cells used to generate the control and Adar1-null tumour cell lines shown in Fig. 3. n = 3 for qPCR experiments and data are representative of two independent experiments. d, Growth inhibition (left two panels) and IFNβ ELISA (right panel) of control and Adar1-null B16 tumour cells modified to delete Ifnar2, Ifngr1 or Stat1 (n = 3 for each condition; data representative of three independent experiments). e, IFNβ secretion in vitro following irradiation with 4 Gy in Adar1-null and control B16 tumour cells with and without IFNAR-blocking antibodies (left). Growth and viability of Adar1-null and control B16 tumour cells in vitro following irradiation with 4 Gy with and without IFNAR-blocking antibodies (right). For both plots: n = 3 for each condition; data are representative of two independent experiments. f, Survival analysis corresponding to the tumour volume curves depicted in Fig. 3h of Adar1 and control tumours treated with therapeutic irradiation. n = 10 mice for each group. Data are representative of two independent experiments. g, Tumour volume and survival analysis of control and Adar1-null B16 tumours treated with topical imiquimod. Data are representative of two independent experiments with n = 10 mice per group. b, e and tumour volume curves, two-sided Student’s t-test; survival curves, log-rank test, *P < 0.05; **P < 0.01; ***P < 0.001; ****P < 0.0001.

