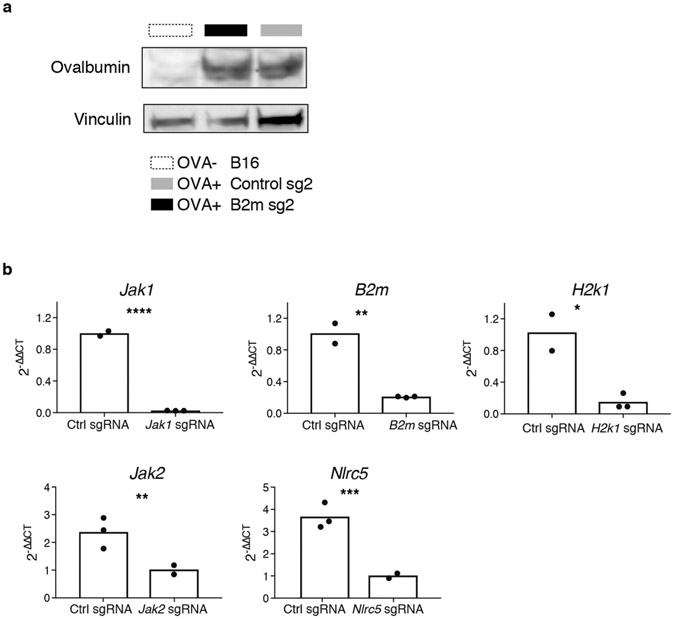
Extended Data Fig. 9 ∣. Corroborating data for models of immunotherapy resistance.
a, Western blot demonstrating the expression of ovalbumin in control and B2m-null B16 tumour cell lines depicted in Fig. 5c. Data are representative of two independent experiments. b, Quantitative PCR and western blots demonstrating loss of expression of B2m, Jak1, H2k1, Jak2, and Nlrc in B16 tumour cell lines used to make epistatically deleted Adar1-null or control tumour cells lines. n = 3 for qPCR experiments and data are representative of two independent experiments with P value calculated using two-sided Student’s t-test, *P < 0.05; **P < 0.01; ***P < 0.001; ****P < 0.0001.

