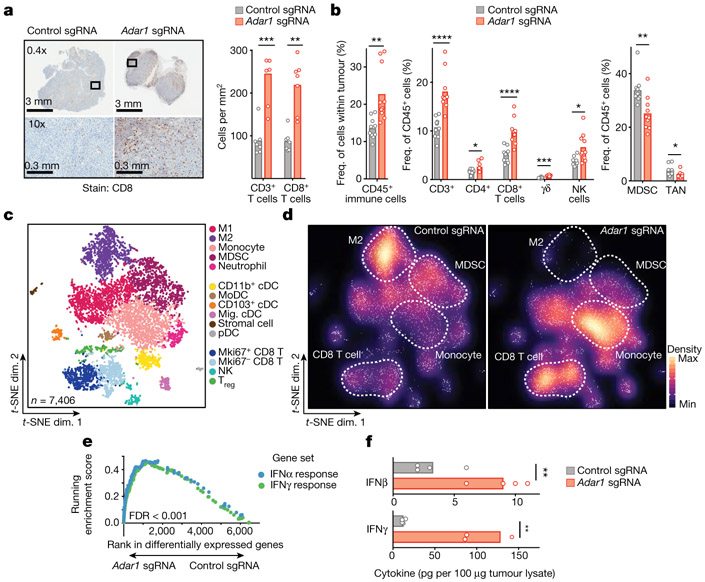
Fig. 2 ∣. Loss of ADAR1 inflames the TME.
a, Immunohistochemistry (left) with quantification (right) of CD3+ and CD8+ T cells in untreated control (grey) or Adar1-null (red) B16 tumours (n = 8 mice per group). b, Flow cytometry of immune populations from untreated control and Adar1-null B16 tumours (representative results from two independent experiments; n= 8–10 mice per group per experiment). TAN, tumour-associated neutrophils. c, d, t-Distributed stochastic neighbour embedding (t-SNE) plot (c) and density plots (d) of 7,406 RNA-sequenced (RNA-seq) single CD45+ cells from Adar1-null and control B16 tumours (n = 2 biological replicates for each population). Treg, regulatory T cells; M1, M1 macrophages; M2, M2 macrophages; cDC, conventional dendritic cells; MoDC, monocyte-derived dendritic cells; pDC, plasmacytoid dendritic cells. e, Gene set enrichment analysis (GSEA) of IFN response signatures in immune cells from Adar1-null compared with control tumours. FDR calculated using GSEA. f, IFNβ and IFNγ protein levels within the TME of Adar1-null and control B16 tumours; n = 4 for each condition. a, b, f, Twosided Student’s t-test;*P < 0.05; **P < 0.01; ***P < 0.001; ****P < 0.0001.

