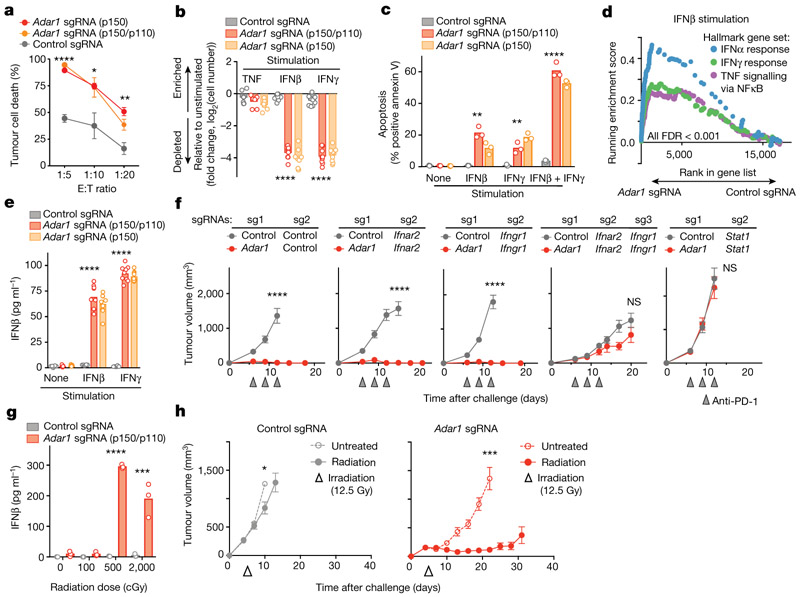
Fig. 3 ∣. Exogenous IFN is required to trigger anti-tumour immunity in Adar1-null tumours.
a, T cell-dependent killing of ovalbumin-expressing Adar1 p150/p110-null (red), p150-null (orange) and control (grey) B16 tumour cells by OT-I transgenic T cells specific for an ovalbumin-derived peptide in the context of MHC-I at decreasing E:T ratios (1:20, 1:10 and 1:5). Data shown are representative of two independent experiments with n = 3 replicates for each condition; mean ± s.e.m. b, Relative numbers of control, Adar1 p150/p110-null, and Adar1 p150-null B16 tumour cells stimulated with cytokines indicated compared with unstimulated conditions (n = 3 for each condition; data are representative of three independent experiments). c, Annexin V staining in control, Adar1 p110/ p150-null and Adar1 p150-null tumours following stimulation with IFNβ, IFNγ or IFNβ + IFNγ (n = 3 for each condition; data are representative of three independent experiments). d, GSEA of gene signatures in Adar1-null compared with control B16 tumour cells after in vitro culture with IFNβ stimulation. n = 3 for each condition; FDR calculated using GSEA. e, Enzyme-linked immunosorbent assay (ELISA) for IFNβ in supernatant from control, Adar1 p150/p110-null and Adar1 p150-null B16 tumour cells after in vitro culture in unstimulated, IFNβ or IFNγ conditions (n = 3 for each condition; data are representative of three independent experiments). f, Tumour volume following treatment with anti-PD-1 in vivo in genetic epistasis tumour models that lack ADAR1 and components of IFN sensing pathways (n = 5 mice in each group, data representative of two independent experiments). g, ELISA for IFNβ in supernatant from control and Adar1 p150/p110-null B16 tumour cells following irradiation in vitro (n = 3 for each condition; data representative of two independent experiments). h, Tumour volume of control (grey) and Adar1-null (red) B16 tumours following therapeutic irradiation in vivo. n = 10 mice in each group; data are representative of two independent experiments. b, c, e, g, Bars represent mean; f, mean ± s.e.m. a–c, e, f, h, Two-sided Student’s t-test; *P < 0.05; **P < 0.01; ***P < 0.001, ****P < 0.0001; NS, not significant.

