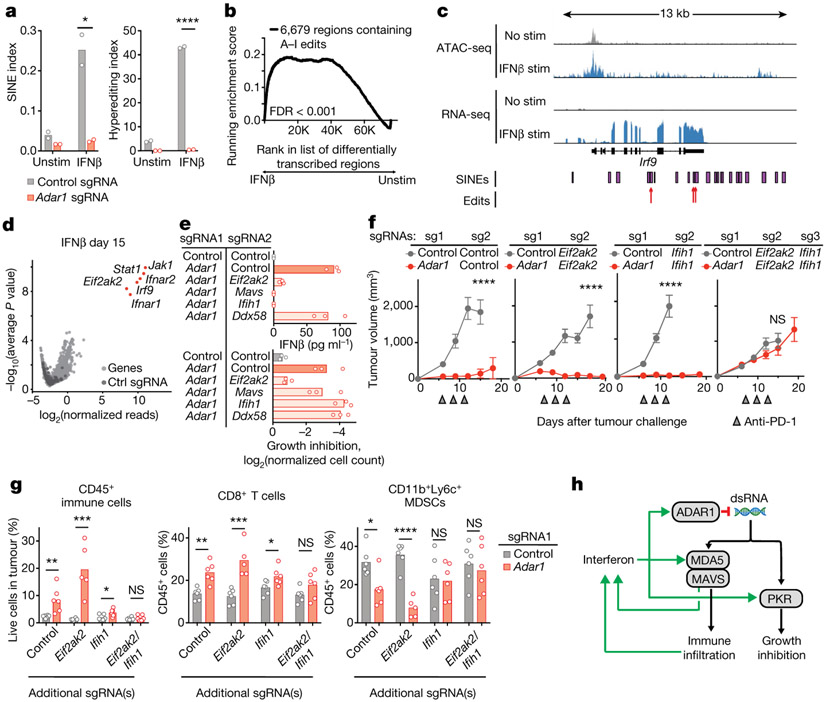
Fig. 4 ∣. dsRNA sensing triggers distinct mechanisms of anti-tumour immunity through MDA5 and PKR in Adar1-null tumours.
a, Quantification of A-to-I editing in SINEs (left) and hyper-editing (right) in control and Adar1-null B16 tumours with and without stimulation with IFNβ (n = 3 for each condition). b, Enrichment in the expression of RNA transcripts containing A-to-I editing sites following stimulation with IFNβ relative to the unstimulated state in control B16 tumour cells. n = 3 for each condition; FDR calculated using GSEA. c, Assay for transposase accessible chromatin with high-throughput sequencing (ATAC-seq) and RNA-seq at the Irf9 locus indicating positions of SINEs and A-to-I edits of RNA in IFNβ-stimulated or unstimulated control B16 cells. d, Volcano plot depicting the relative depletion and enrichment of sgRNAs targeting 20,146 genes in a Cas9+ Adar1-null B16 tumour cell line following stimulation with IFNβ in vitro. p values were derived using STARS v1.3. e, IFNβ secretion (top) and IFNγ-mediated growth inhibition (bottom) in Adar1-null (red) and control (grey) B16 cells with additional deletion of Eif2ak2 (PKR), Mavs (MAVS), Ifih1 (MDA5), or Ddx58 (RIG-I) (n = 3 for each condition; data are representative of two independent experiments). f, Tumour volume following anti-PD-1 treatment of B16 tumours with the genetic perturbations indicated (n = 5 mice per group; data are representative of two independent experiments). g, Flow cytometry of immune populations from untreated control and Adar1-null B16 tumours with the genetic perturbations indicated (n = 5 mice per group). h, Schema of the genetic dependencies of enhanced immune infiltration and enhanced susceptibility to immune cells in Adar1-null tumours, a, e, g, Bars represent mean; f, mean ± s.e.m. a, f, g, Two-sided Student’s t-test; *P < 0.05; **P < 0.01; ***P < 0.001; ****P < 0.0001; NS, not significant.

