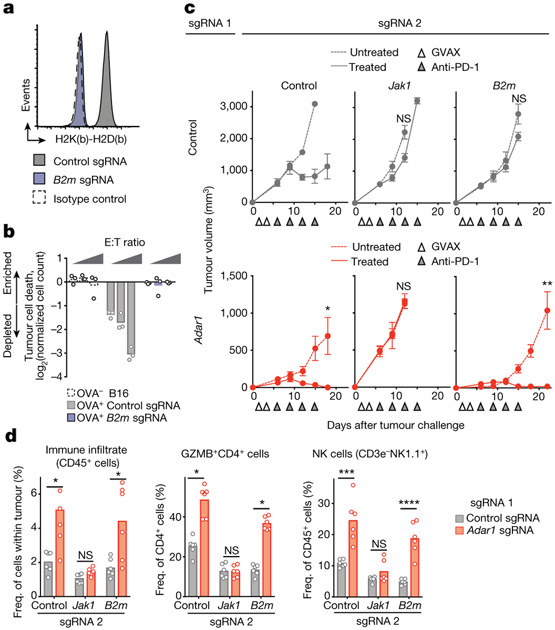
Fig. 5 ∣. Loss of ADAR1 overcomes resistance to immunotherapy mediated by loss of antigen presentation.
a, MHC I expression in control (grey) and B2m-null (purple) B16 tumour cell lines relative to isotype control (dashed line). Data are representative of two independent experiments. b, T cell killing assay with non-ovalbumin-expressing control (dashed line), ovalbumin-expressing control (grey) and ovalbuminexpressing B2m-null (purple) B16 cells (n = 3 for effector target ratios 1:20, 1:10 and 1:5 for each condition; data shown are representative of two independent experiments). c, Tumour volume following anti-PD-1 and GVAX treatment of B16 tumours with the genetic perturbations indicated. Data (mean ± s.e.m.) are representative of two independent experiments with n = 5 mice in each group. d, Flow cytometry of immune populations following anti-PD-1 and GVAX treatment of B16 tumours with the genetic perturbations indicated (n = 5 mice per group). Bars represent mean. c, d, Two-sided Student’s t-test; *P < 0.05; **P < 0.01; ***P < 0.001; ****P < 0.0001; NS, not significant.

