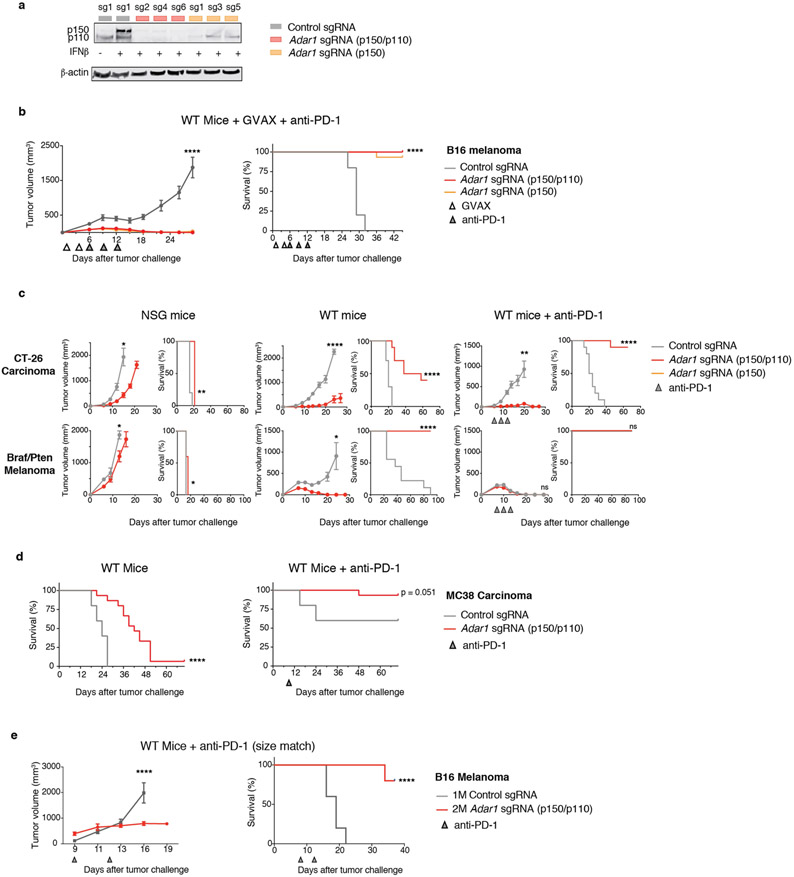
Extended Data Fig. 1 ∣. Supporting evidence that ADAR1 loss enhances the response to immunotherapy.
a, Expression of ADAR1 protein in control (grey), Adar1 p150-null (orange) and Adar1 p150/p110-null (red) B16 cells. Results are representative of three independent experiments. b, Tumour volume (left) and survival analysis (right) of control (grey), Adar1 p150-null (orange) or Adar1 p110/p150-null (red) B16 tumours in GVAX- and anti-PD-1-treated wild-type C57BL/6 mice. n = 5 animals per guide with two separate guides for the control group and at least two separate guides for each Adar1-null group. Data are representative of two independent experiments. c, Tumour volume and survival analysis of control (grey), Adar1 p150-null (orange) or Adar1 p110/p150-null (red) CT26 and Braf/Pten tumours in NSG, wild-type and wild-type anti-PD-1-treated mice. n = 5 mice per group; data are representative of two independent experiments. d, Survival analysis of control and Adar1-null MC38 tumours in wild-type and wild-type anti-PD-1-treated C57BL/6 mice. n = 5 animals per guide with two separate guides for the control group and three separate guides for the Adar1-null group. Data are representative of two independent experiments. e, Tumour volume and survival analysis of Adar1-null and control B16 tumours size matched at the time of PD-1 treatment initiation. b–e, Tumour volume curves are mean ± s.e.m and assessed with Student’s t-test; survival curves assessed with log-rank test, *P < 0.05; **P < 0.01; ***P < 0.001; ****P < 0.0001.

