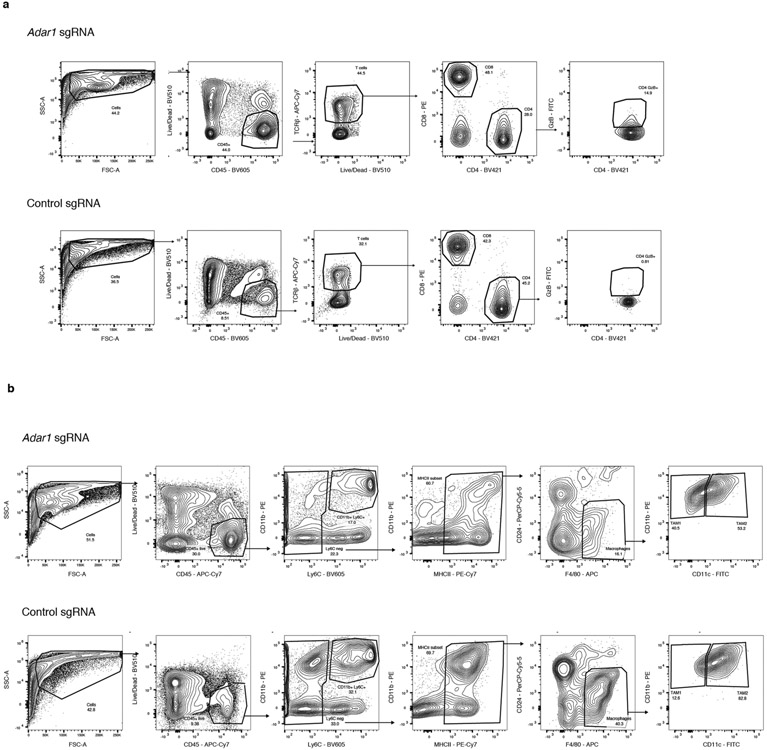
Extended Data Fig. 3 ∣. Further flow cytometry gating strategies and representative plots.
a, Gating strategy and representative flow cytometry plots for the assessment of granzyme B+CD4+ T cells in Adar1-null and control B16 tumours. b, Gating strategy and representative flow cytometry plots for the assessment of TAM1 and TAM2 populations in Adar1-null and control B16 tumours.

