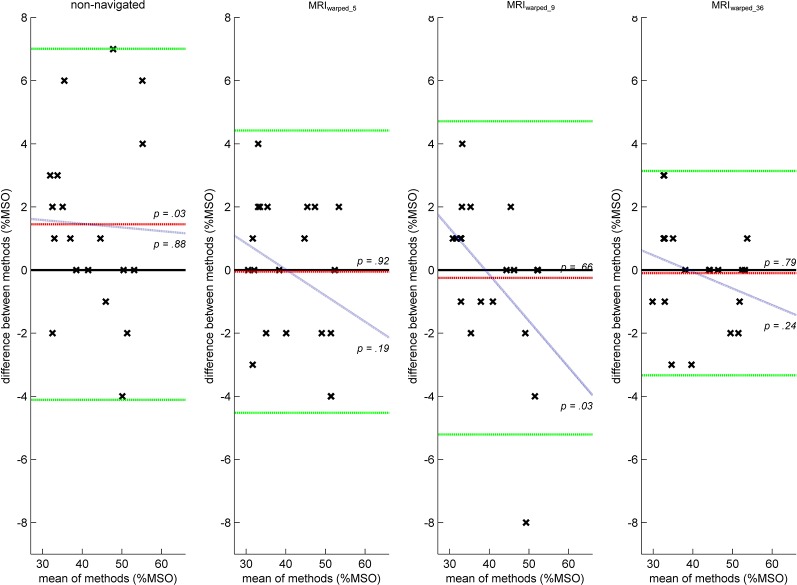
Figure 2.
Bland-Altman plots illustrating the agreement of resting motor threshold (RMT) estimates between conditions. Positions of data points (x) represent the absolute differences of RMT estimates (y-axis) plotted against the mean RMT estimates (x-axis) of two different methods assessed twice in 10 subjects. RMT estimates assessed by navigated transcranial magnetic stimulation (nTMS) with individual anatomical MRI (MRIindividual) were considered reference values and compared to either RMT estimates assessed by nTMS with individualized MRI following a 5-, 9- or 36-point head surface registration (MRIwarped_5, MRIwarped_9, MRIwarped_36) or non-navigated TMS. Ideal agreements of methods would result in differences of 0%MSO irrespective of the RMT magnitude. Red lines indicate the mean difference between methods and right-hand p-values are the results of paired t-tests between methods with p-values lower than 0.05 indicating a fixed bias. Blue lines represent results from a linear regression of differences and mean values of methods. In ideal situations, differences between methods should not be correlated with the magnitude of assessed parameters. Right-hand p-values indicate if there was a significant slope of the regression function with p-values lower than 0.05 indicating a proportional bias. Green lines indicate the upper and lower lines of agreement between methods and span an interval of two standard deviations above and below the mean difference. Outliers beyond lines of agreement render methods by definition not equivalent. Concerning RMT estimates, only MRIwarped_5 and MRIwarped_36 conditions yielded results that were equivalent to MRIindividual estimates.

