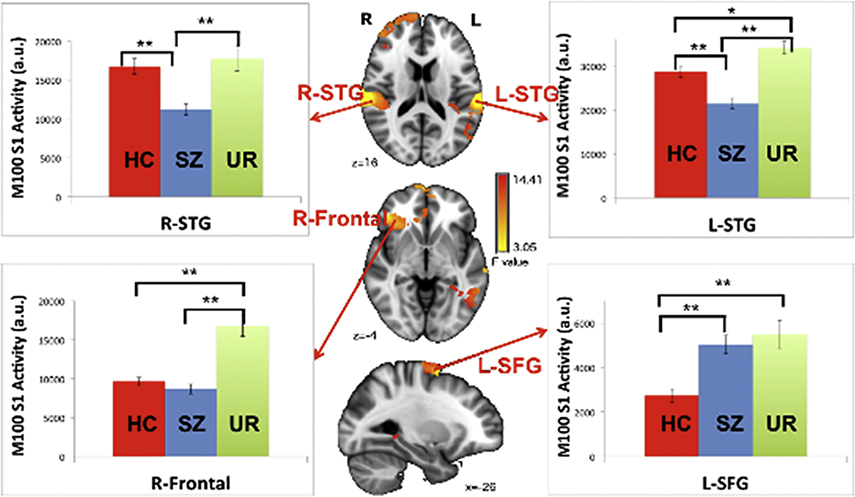
Figure 4.
Analysis of variance (ANOVA) group differences and associated bar charts showing results of 100 ms (M100) simple-effects analyses at the 4 identified regions of interest (ROIs) (*p < .05, **p < .001). From YH Chen, B Howell, JC Edgar. Associations and Heritability of Auditory Encoding, Gray Matter, and Attention in Schizophrenia. Schizophr Bull. 2018 doi:10.1093/schbul/sby111

