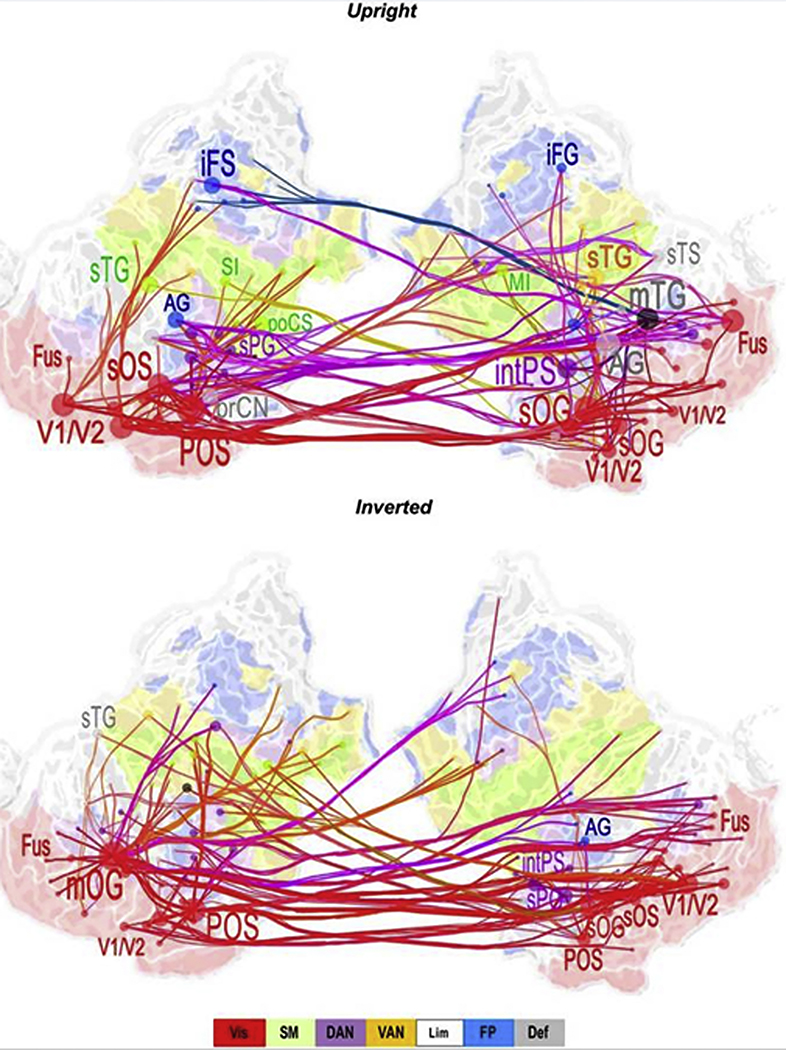
Figure 5.
Low gamma (30–40 Hz) band cortical networks stronger for controls than Sz for upright faces (top) and inverted faces (bottom). Graphs display the 200 strongest connections on a flattened, inflated cortical surface. Red = visual network (Vis); Green = sensorimotor network (SM); Purple = dorsal attention network (DAN); Yellow = ventral attention network (VAN); Blue = Frontoparietal network. AG = angular gyrus; iFS/G = inferior frontal sulcus/gyrus; MI = primary motor cortex; mOG = middle occipital gyrus, mTG = middle temporal gyrus; Fus = fusiform gyrus; POS = parieto-occipital sulcus; prCN = precuneus; SI = primary somatosensory cortex; sTG = superior temporal gyrus. From J Hirvonen, M Wibral, JM Palva. Whole-Brain Source-Reconstructed MEG-Data Reveal Reduced Long-Range Synchronization in Chronic Schizophrenia. eNeuro, 2017 4(5).

