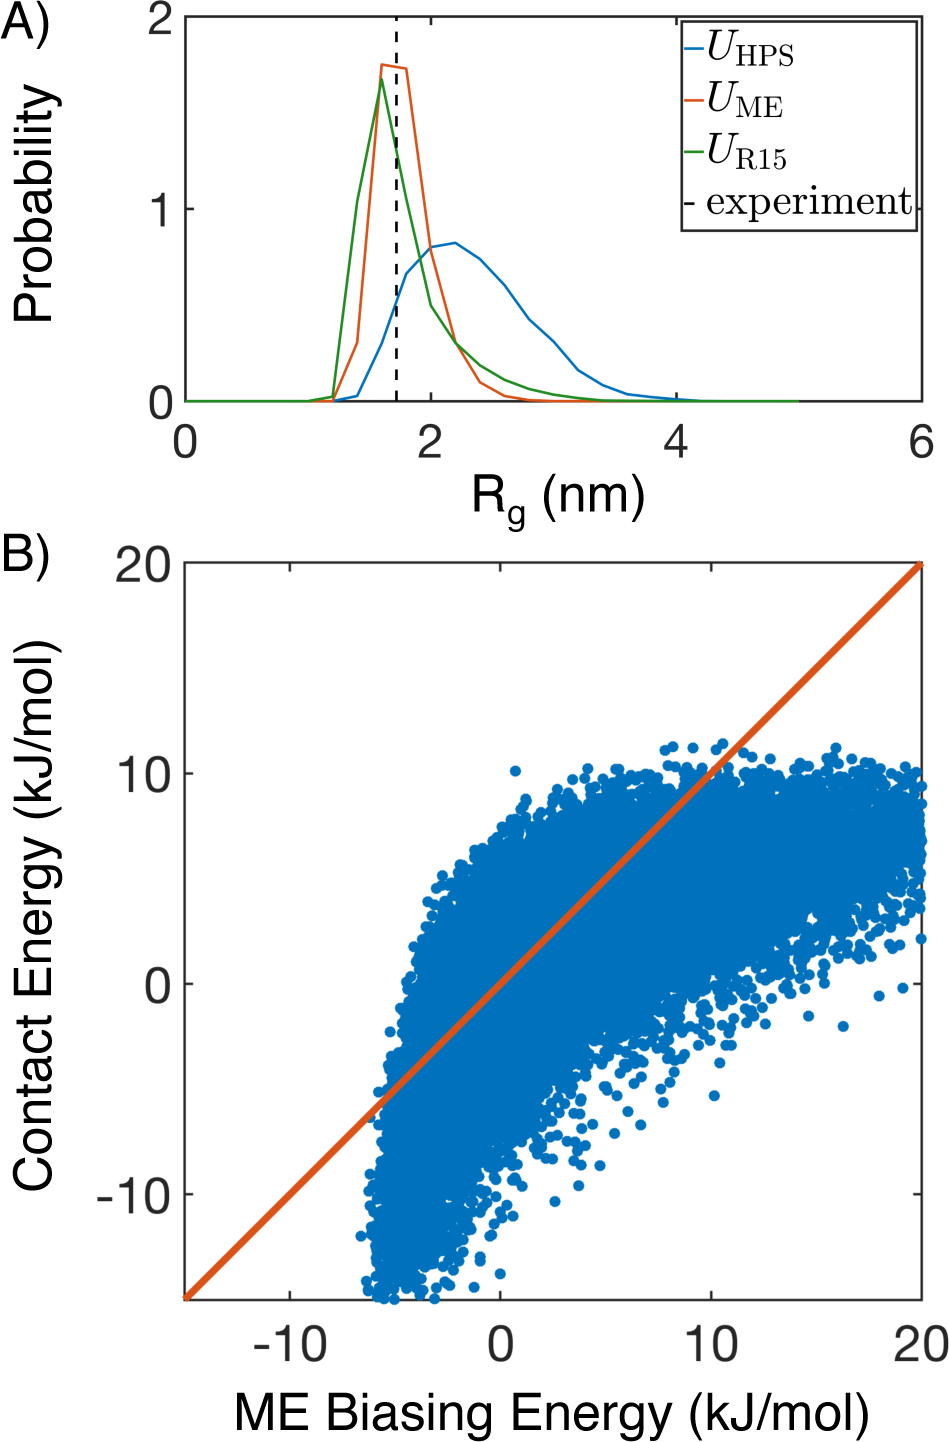
Figure 2:

Illustration of the force field parameterization algorithm on a single protein, R15. (A) Comparison between the mean experimental value (black, dashed) for Rg and probability distributions obtained from simulating the hydrophobic scale model (UHPS(r), blue), the maximum entropy optimized model (UME(r), orange), and MOFF for this specific protein (UR15(r), green). (B) Correlation between contact energies obtained from linear fitting and the original maximum entropy biasing energy . The diagonal line (orange) is provided as a guide to the eye.
