
Figure 3:
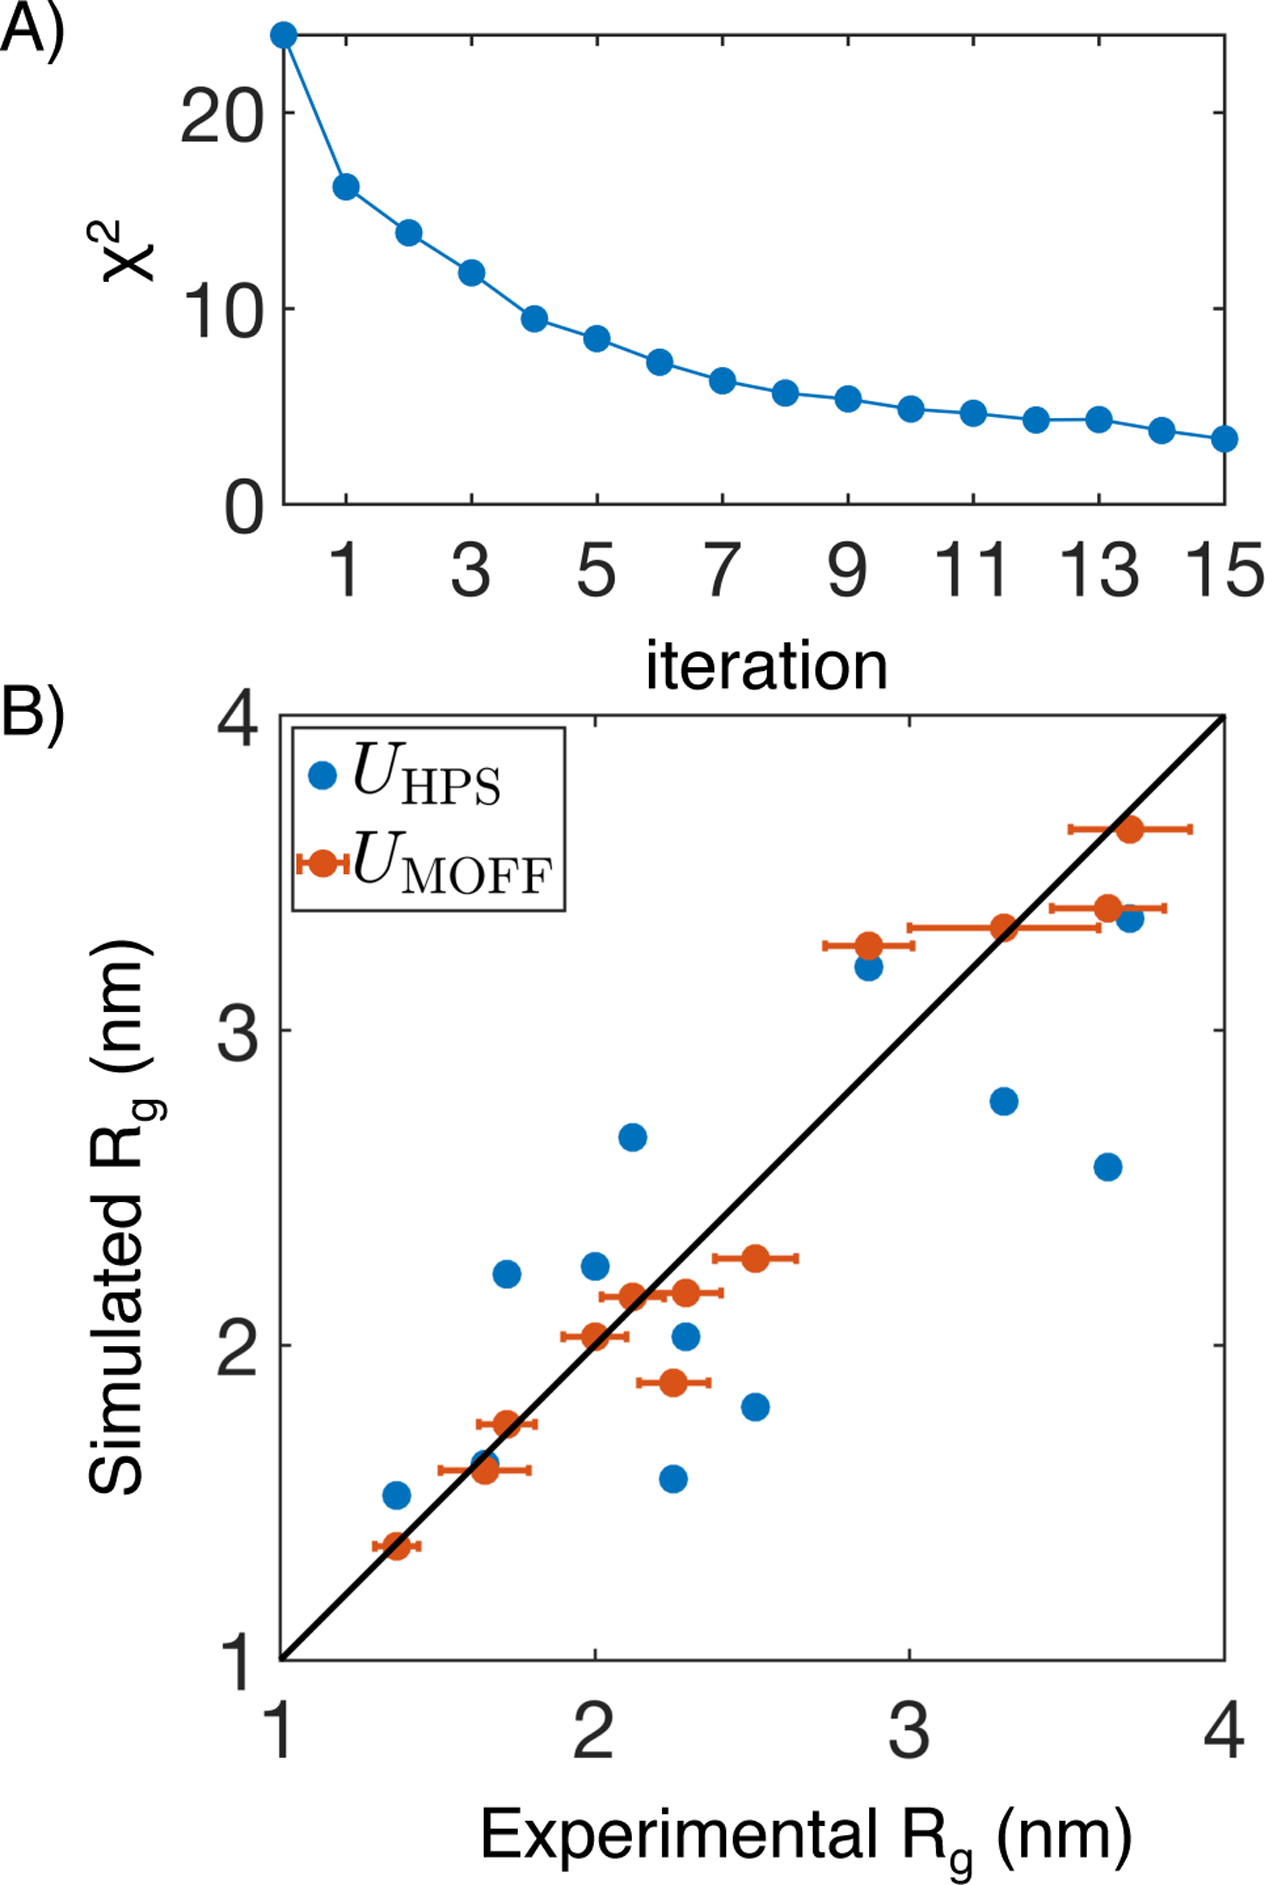
MOFF improves the prediction of Rg for proteins includes in the training set. (A) χ2 that measures the normalized difference between simulated and experimental Rg values as a function of the number of iterations for force field optimization. (B) Comparison between experimental Rg and those predicted by the hydrophobic scale model (UHPS(r), blue) and MOFF (UMOFF(r), orange). Error bars represent experimental standard deviations. Simulation errors are comparable to the symbol size.