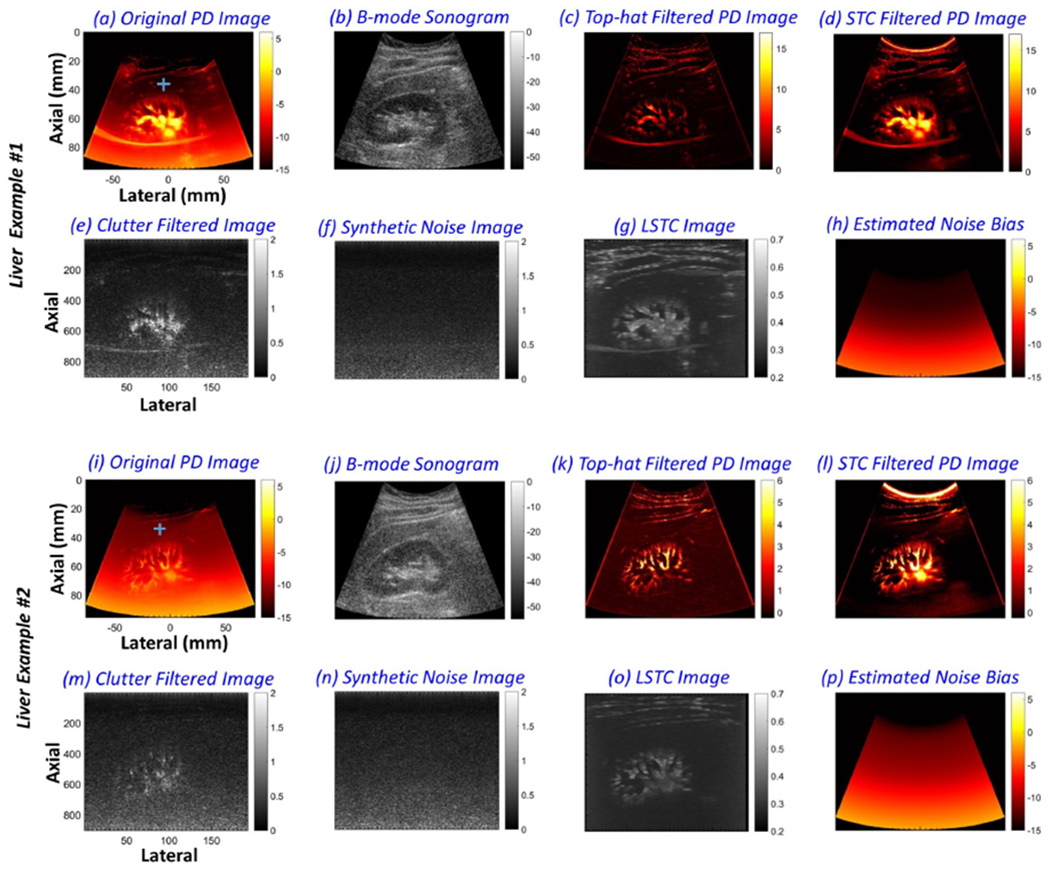
Figure 10:

Montage of renal microvascular power Doppler (PD) images (a, i), B-mode sonograms (b, j), top-hat filtered PD images (c, k), background-suppressed PD images (d, l) and the corresponding noise field (h, p) obtained using the proposed technique, clutter-filtered IQ images (e, m), synthetic noise images (f, n), and the local spatio-temporal correlation images (g, o), from two healthy volunteers. Blue horizontal and vertical regions of interest (ROIs) in (a, i) indicate the data points sampled for quantitative assessments in Figures 11 and 12. To compare the estimated noise field with the actual, the ROIs were located in a region devoid of any flow or residual tissue signal.
