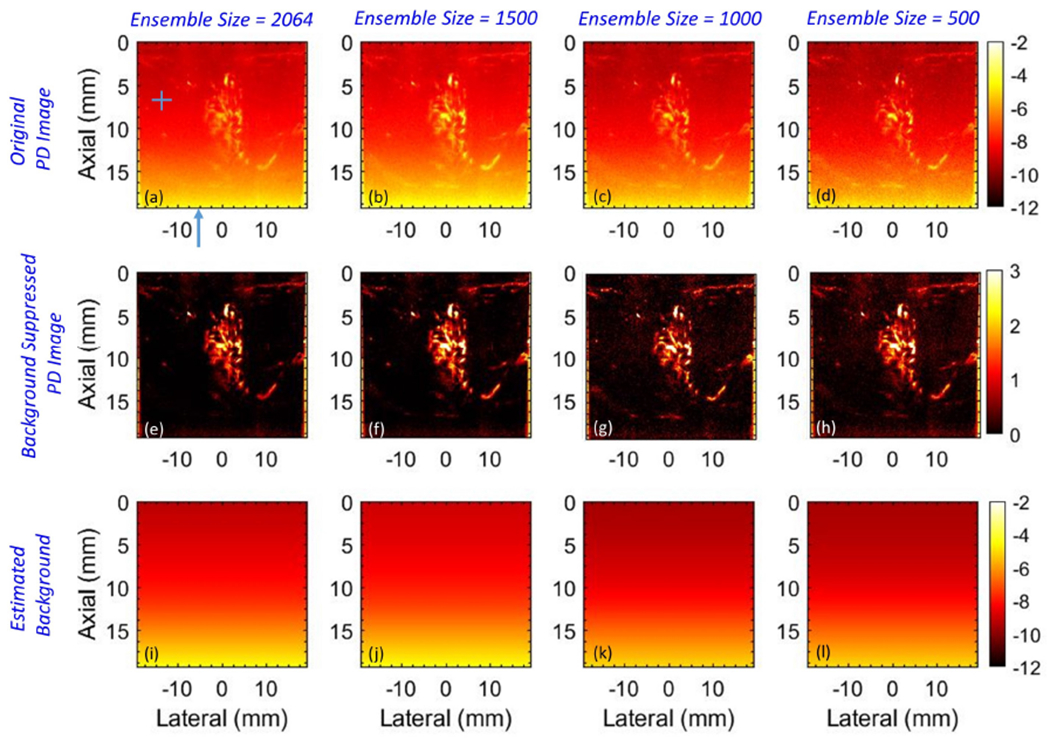
Figure 13:

Montage of power Doppler images before (a-d) and after (e-h) background suppression, and the corresponding noise fields (i, l) with ensemble size 2064, 1500, 1000 and 500 IQ frames, going left to right. The horizontal and vertical regions of interest (ROIs) in (a) indicate the data points sampled for quantitative assessments in Figures 14 and 16. The blue arrow in (a) indicates column # 71 in reference to Figure 14. The ROIs and the column were specifically positioned in a region devoid of any flow or residual tissue to achieve a fair comparison of the estimated noise field with the actual.
