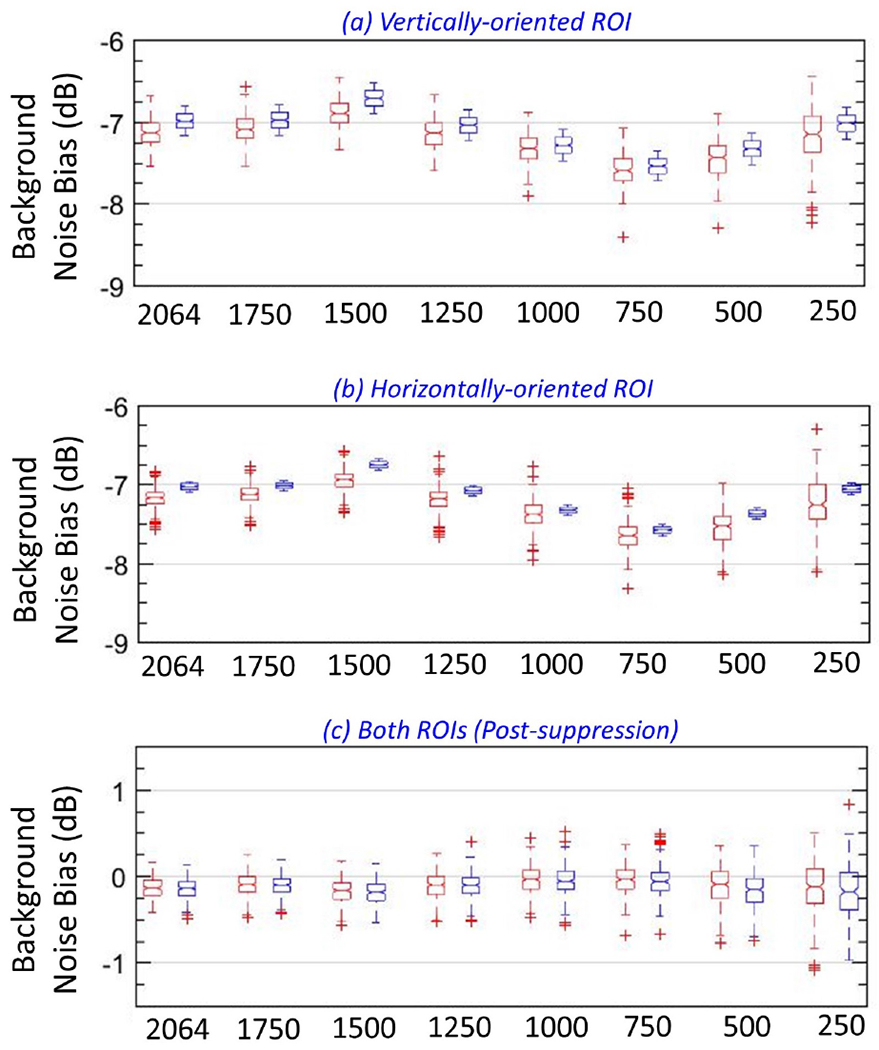
Figure 16:

Box-and-whisker plots of actual (red) and estimated (blue) noise field from vertical (a) and horizontal (b) regions of interest (ROIs), for different ensemble sizes. (c) Box-and-whisker plots of the noise-suppressed power Doppler data from vertical (red) and horizontal (blue) ROIs, for different ensemble sizes.
