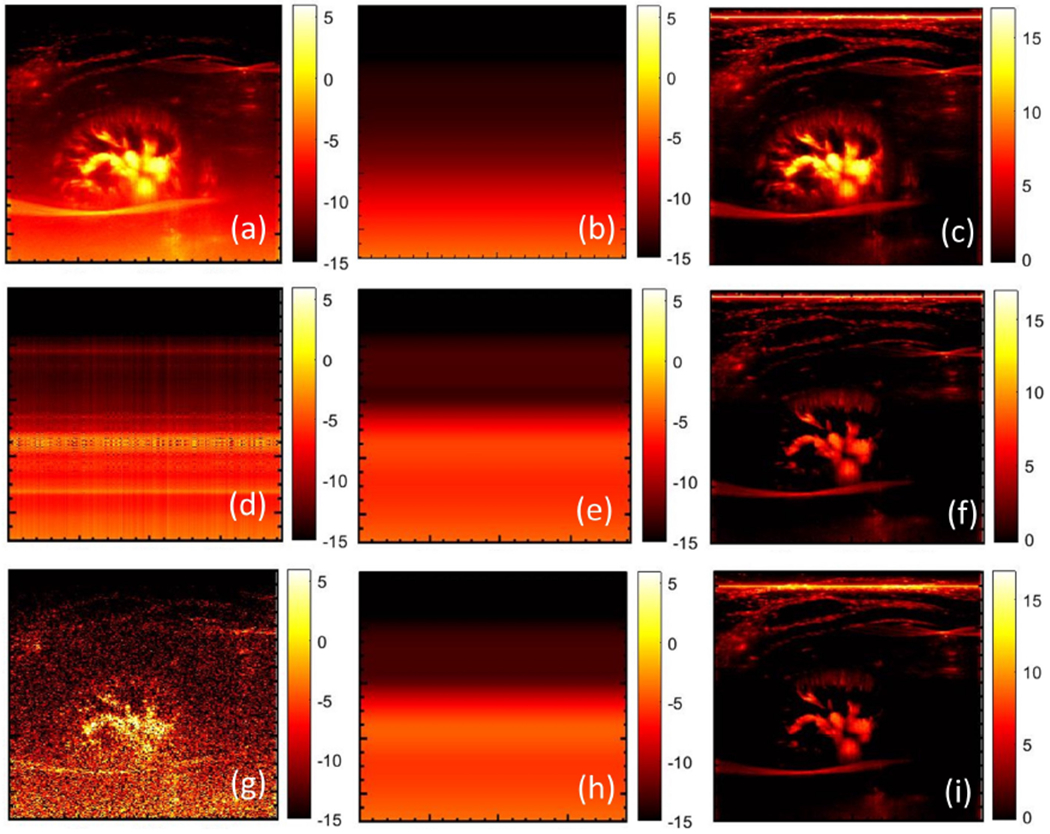
Figure 17:

(a) original power Doppler image of renal vasculature, (b) noise field estimated using STC filter and the corresponding background suppressed power Doppler image (c). (d) Estimated first-rank approximation of the original power Doppler image of (a), smoothened using the 2D least square technique (e), followed by noise bias suppression (f). (g) Single clutter-filtered image, with least square based background smoothening (h), and the corresponding noise bias suppressed power Doppler image (i).
