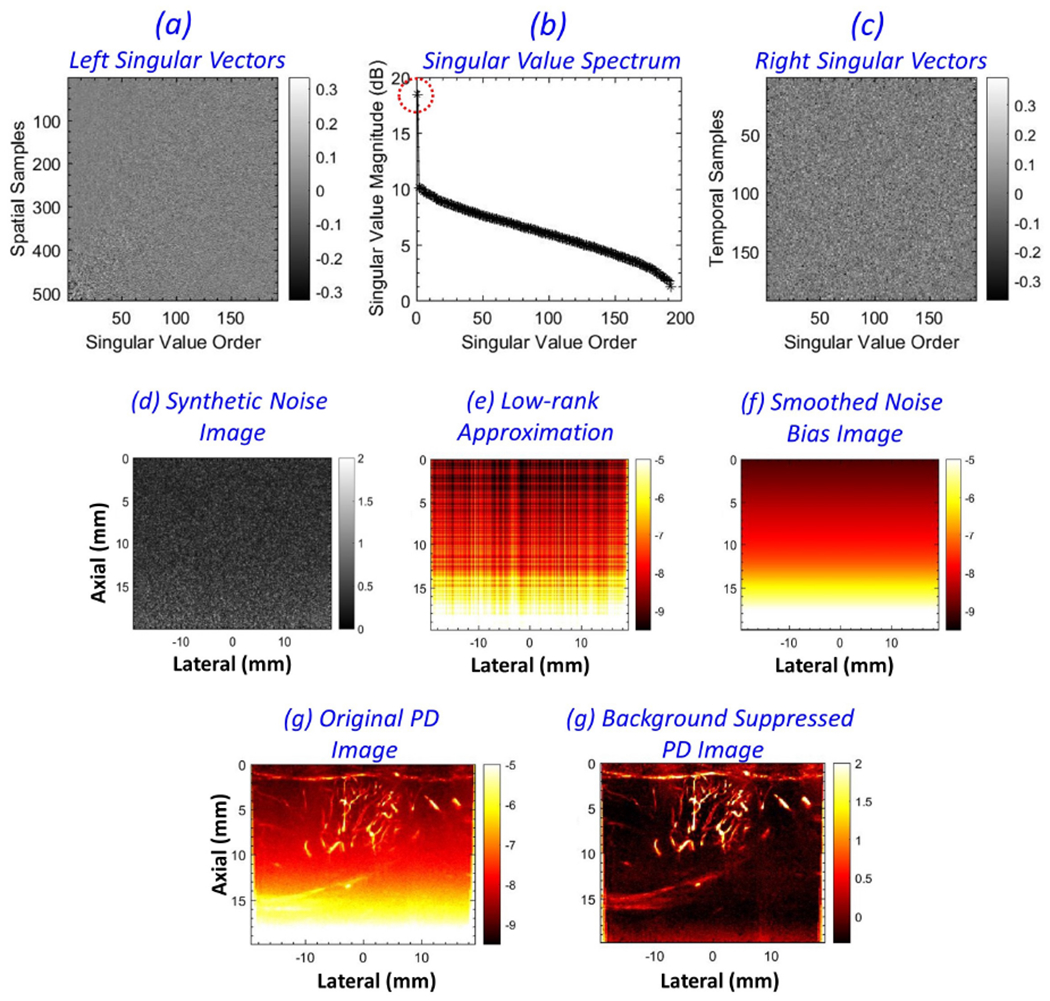
Figure 7:

Pictorial description of noise field estimation from a synthetic noise image. (a-c) left singular vectors, singular value spectrum and the right singular vectors, respectively, derived from singular value decomposition of the synthetic noise image (d). (e) low-rank approximation of the synthetic noise image, corresponding to the lowest singular order with the highest singular value. (f) the smoothed noise bias image obtained after 2D least square plane-fitting. (g, f) the corresponding power Doppler images before and after noise bias suppression, respectively.
