
Figure 3.
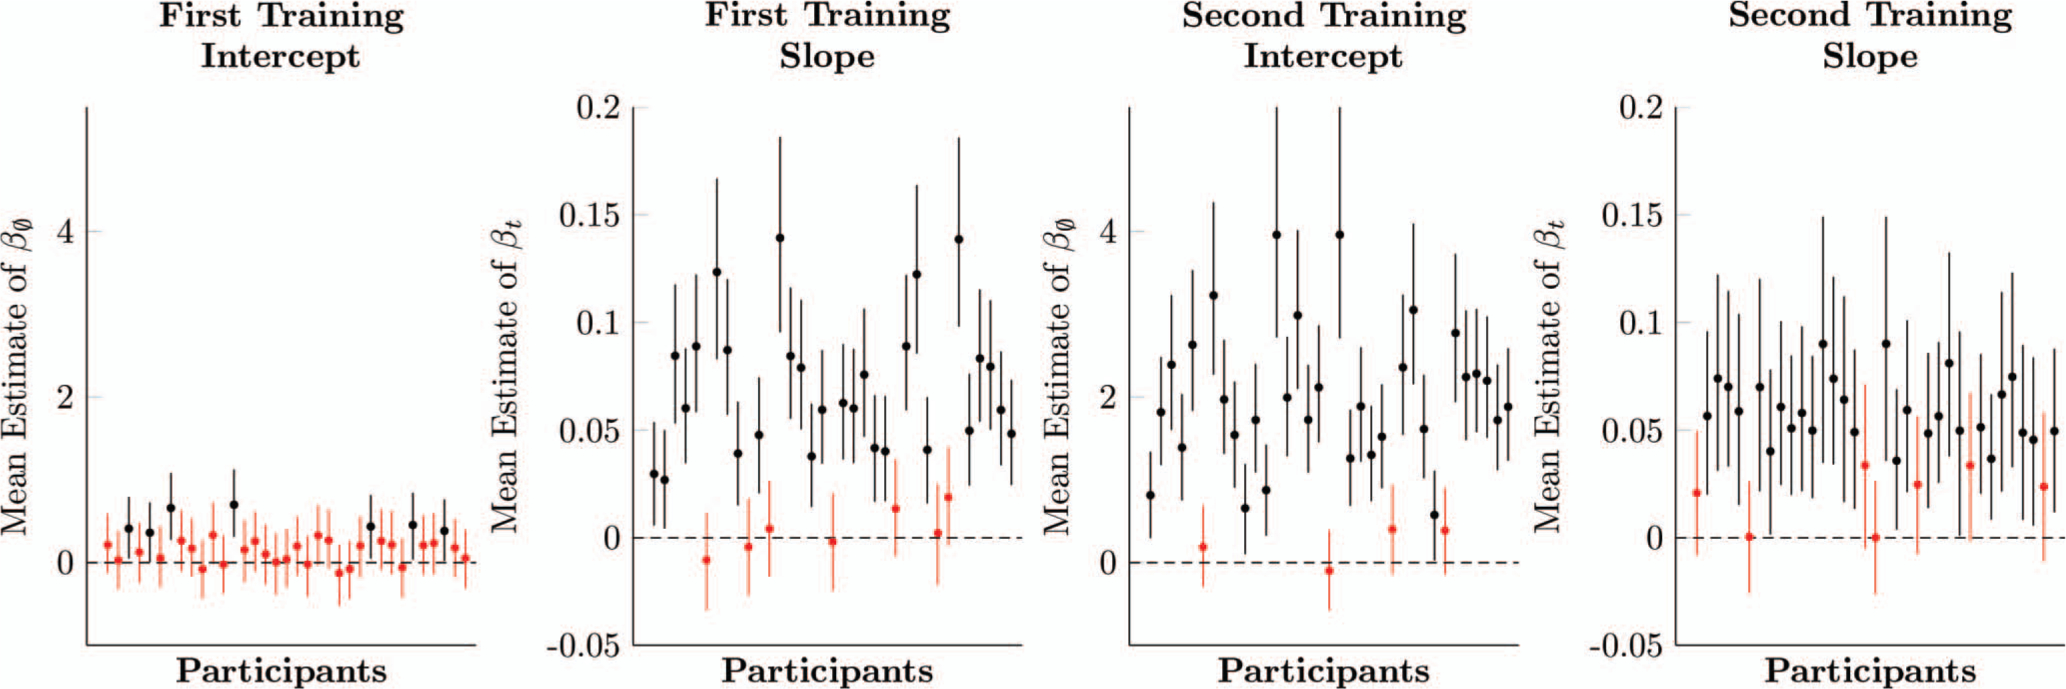
Estimates of logistic regression parameters for each participant, based on multilevel models, of first training (left column) and second training (right column) in Experiment 1. Whiskers on each estimate denote its 95% posterior credible interval. Estimates in red include zero within their credible intervals, whereas estimates in black do not. See the online article for the color version of this figure.