
Figure 4.
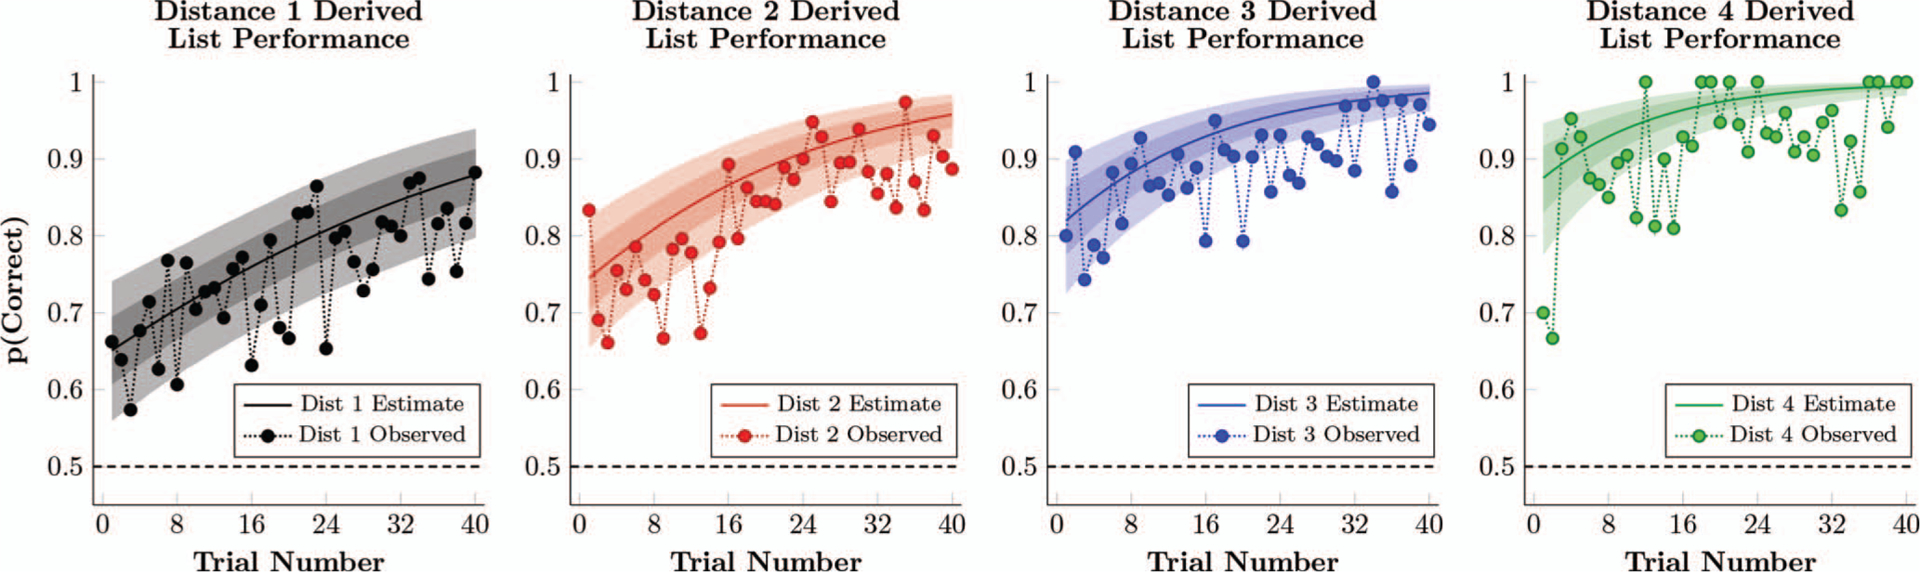
Observed proportion of correct responses in Experiment 1, as well as the estimated performance of a participant whose logistic regression parameters (Equation 2) are the respective posterior population means. This estimate also includes the 80% credible interval (dark shaded region) and 99% credible interval (light shaded region) for the estimates performance. See the online article for the color version of this figure.