
Figure 8.
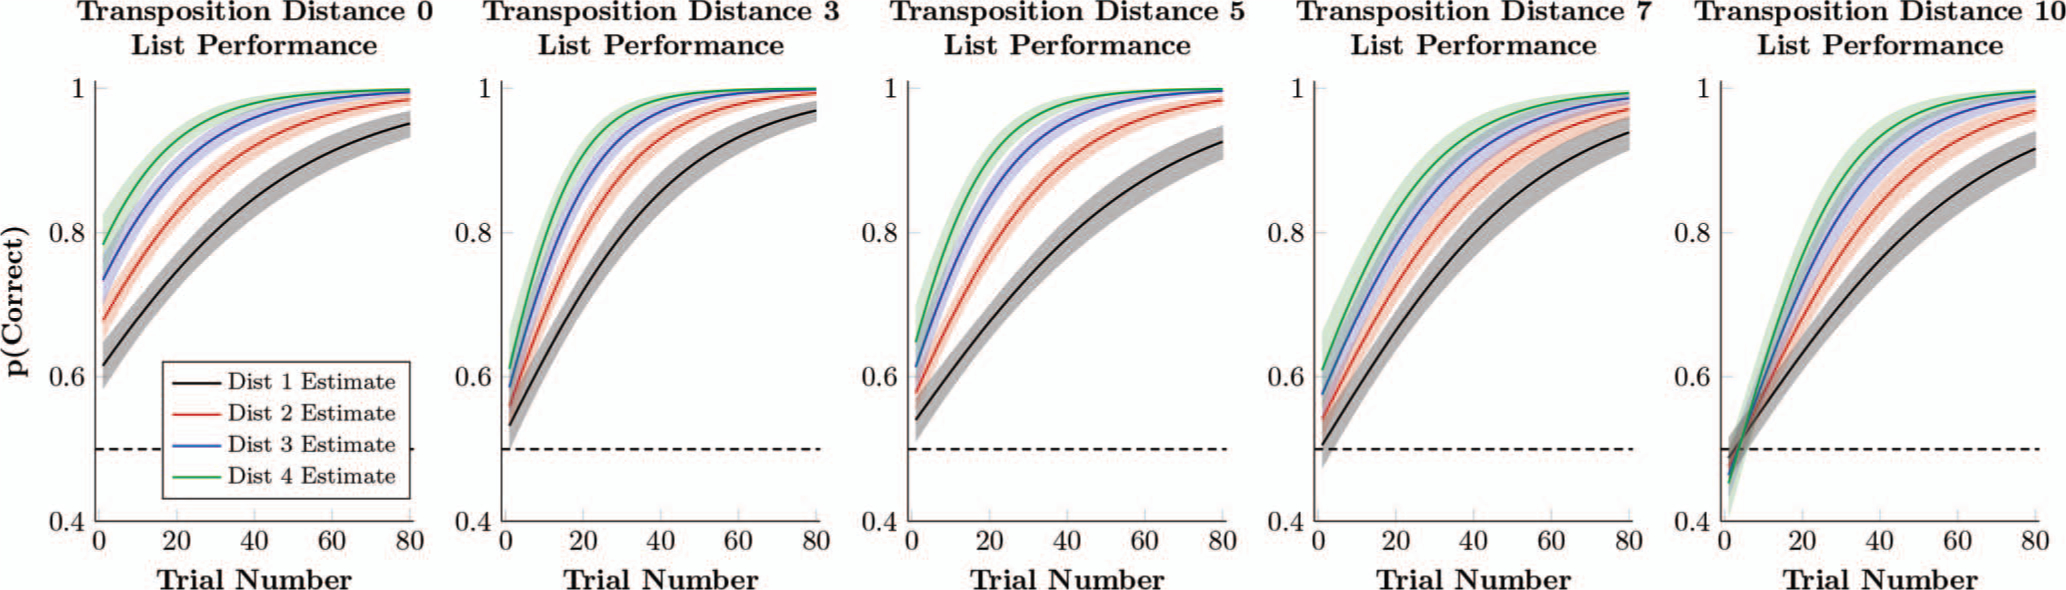
Estimated proportion of correct responses by a hypothetical participant whose logistic regression parameters (Equation 2) are the respective posterior population means. This estimate also includes the 80% credible interval (dark shaded region) and 99% credible interval (light shaded region) for the estimates performance. Performance is separated by symbolic distance (D = 1 in black, D = 2 in red, D = 3 in blue, D = 4 in green). See the online article for the color version of this figure.