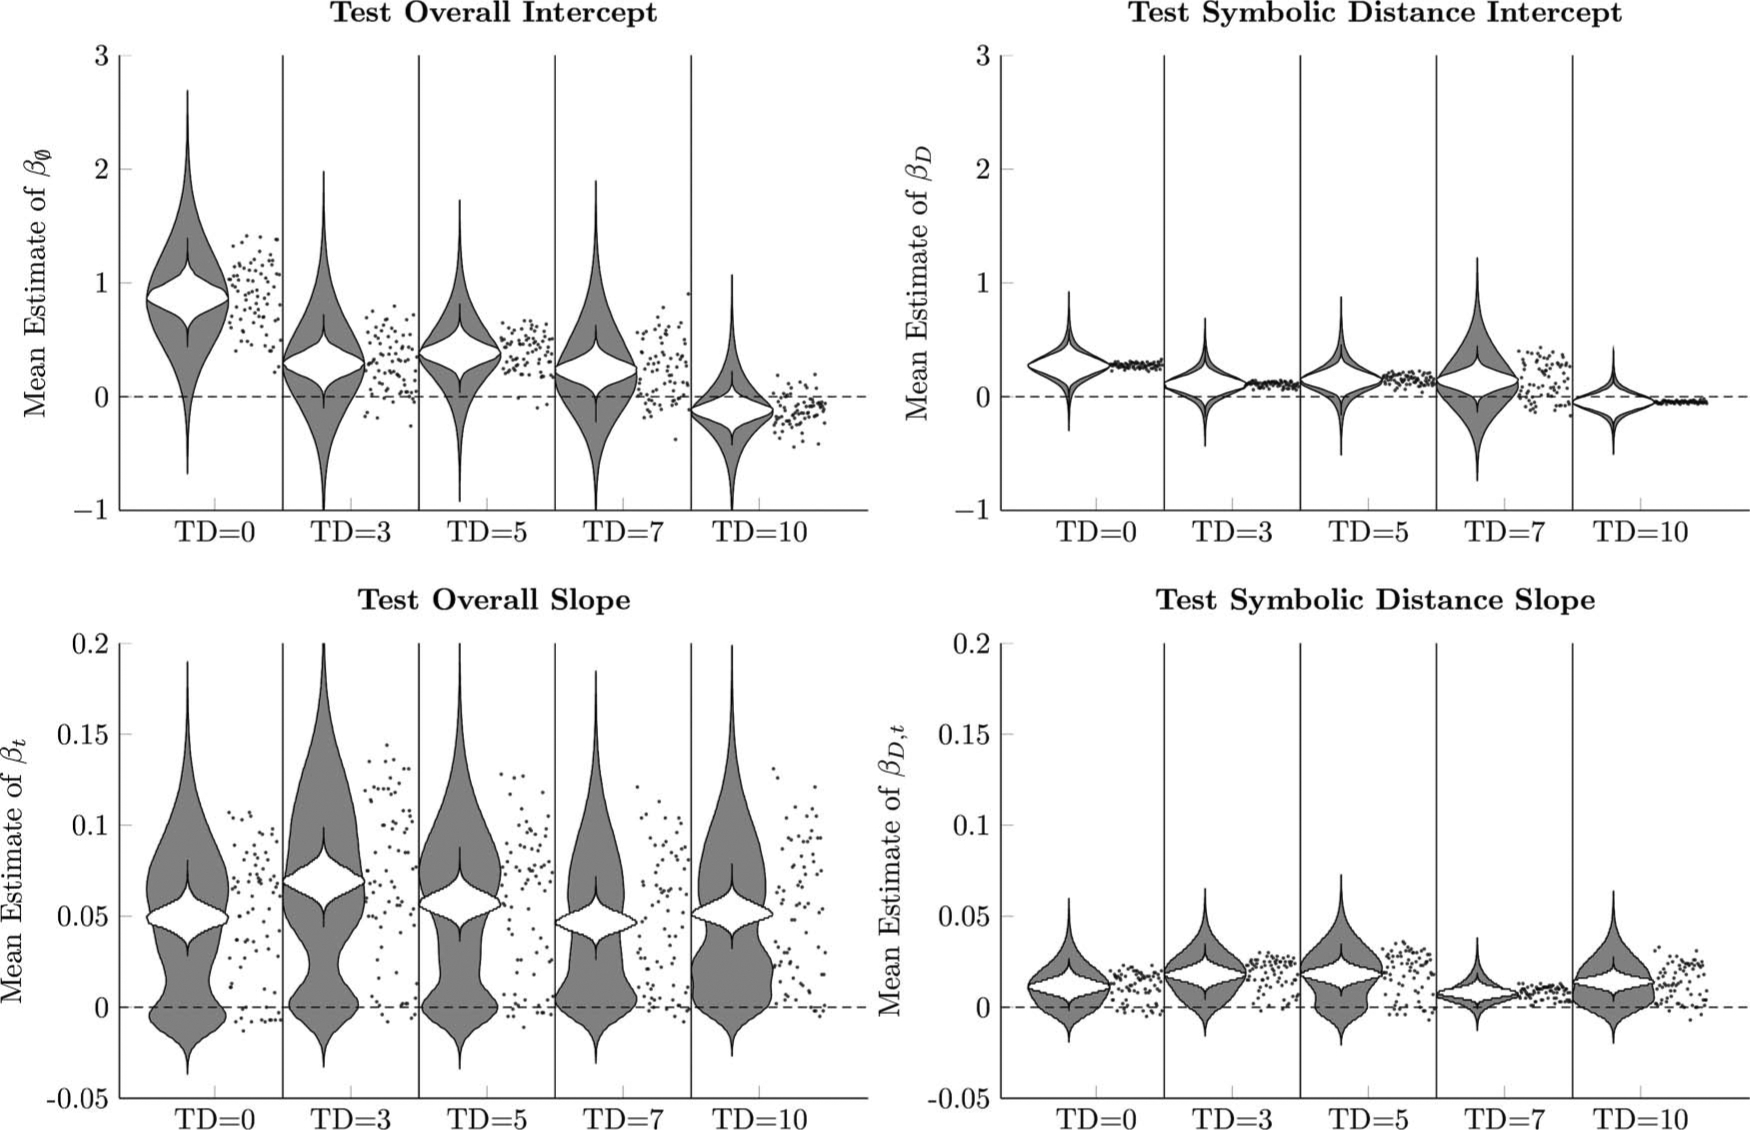
Figure 9.

Logistic regression parameters (Equation 2) in Experiment 2 for each of the five transposition distances that participants experienced. White violin plots represent posterior distributions for the population means of logistic regression parameters (Equation 2) in Experiment 2. Gray violin plots represent the posteriors of individual means, taken jointly across all participants. Points to the right of each pair of violin plots represent the mean parameter estimates for each participant.
