
Figure 3: Forest plot of proportion of treatment success for the primary outcome by age ranges, post hoc.
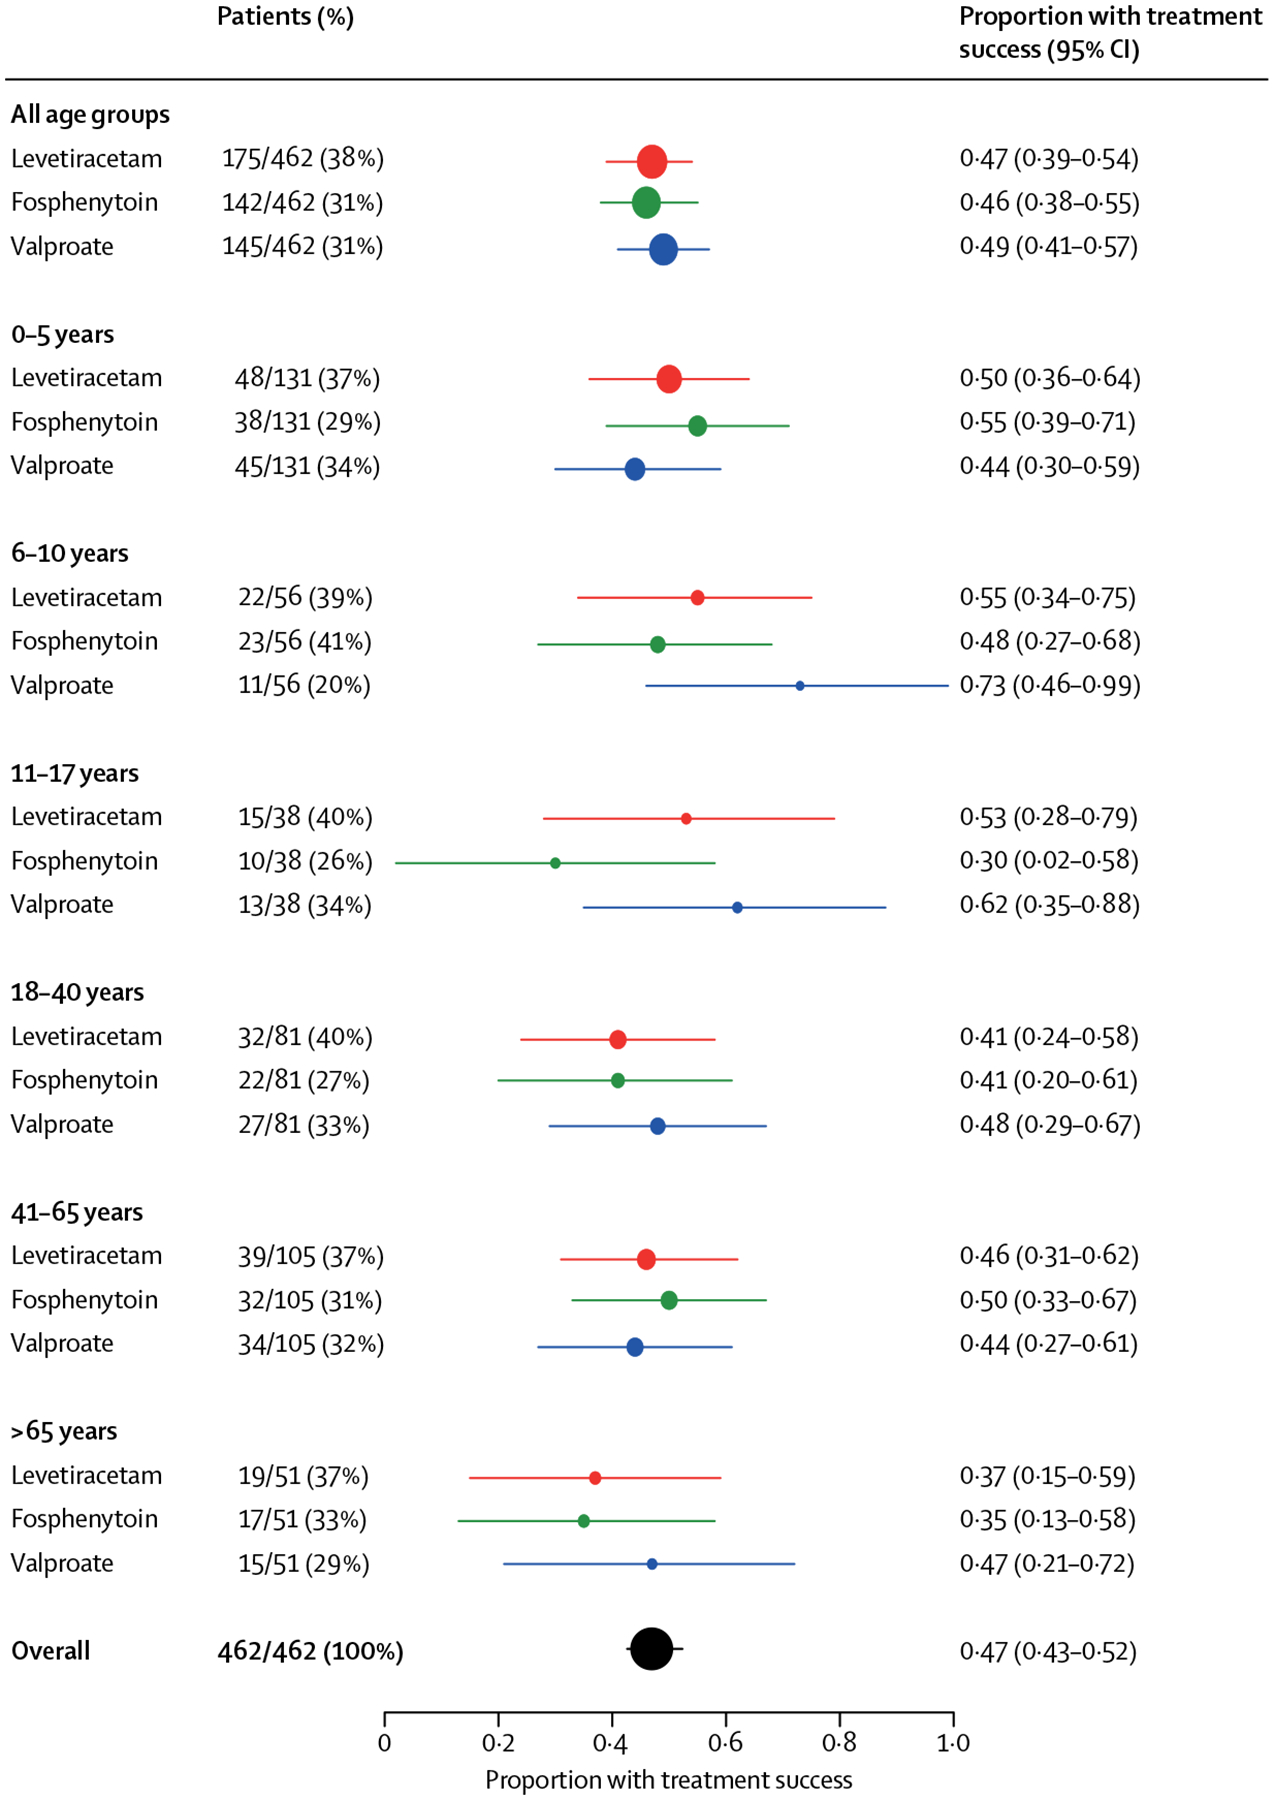
The size of the circle in each row is representative of the number of patients in that group and the error bars show 95% CIs. These narrower age groupings were determined post hoc.