
Figure 4.
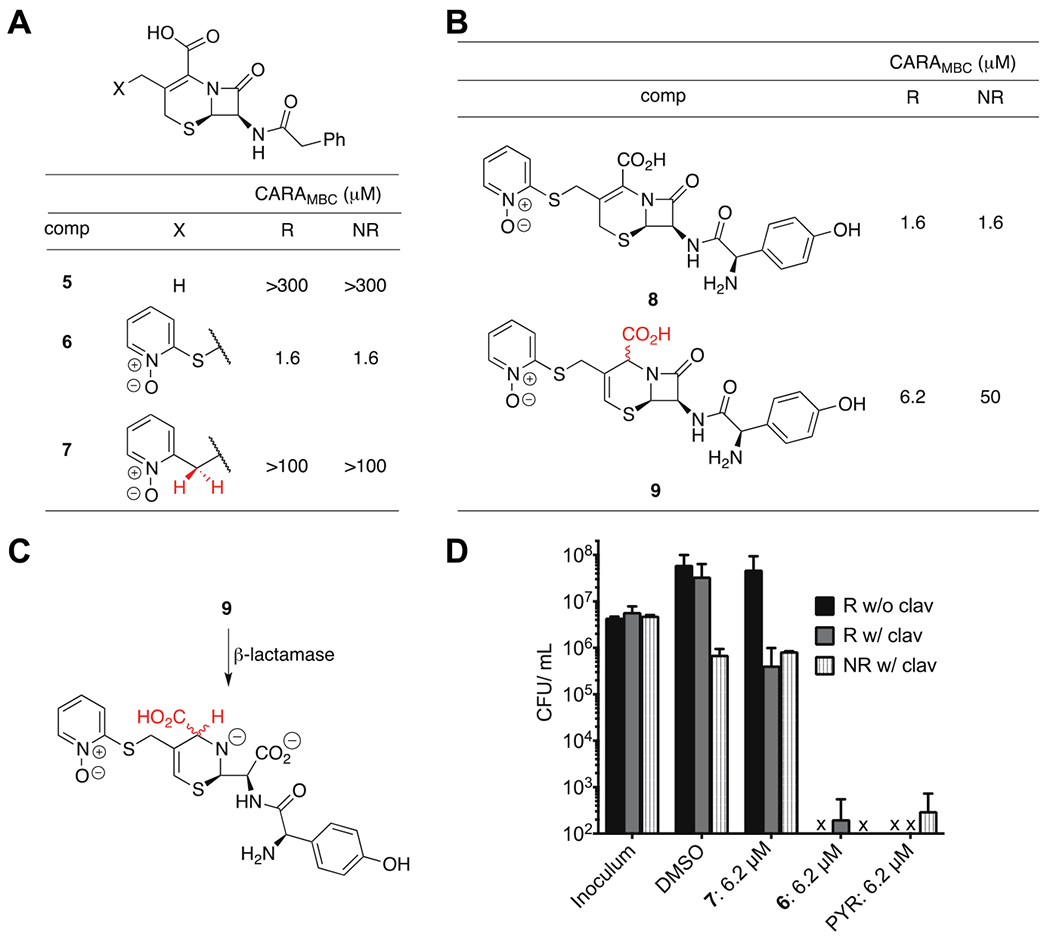
(A) Comparison of a compound able to release PYR (6) with analogues lacking a PYR moiety (5 and 7). Activity was measured as CARAMBC. (B) Comparison of a compound able to release PYR (8) with an analogue unable to do so (9). (C) Ring-opened form of compound 9. (D) CFU/mL reduction after 7 days of compound 6 and 7 exposure under R conditions without 25 μM clavulanate (black bar) or with clavulanate (gray bar) or NR conditions with clavulanate (striped bar). CARAMBC represents the concentrations at which compounds reduced the fluorescent signal to or below 1% of the signal seen with 1% DMSO as a control. CFU/mL reduction experiments were conducted in triplicate, and bars represent mean ± SD.