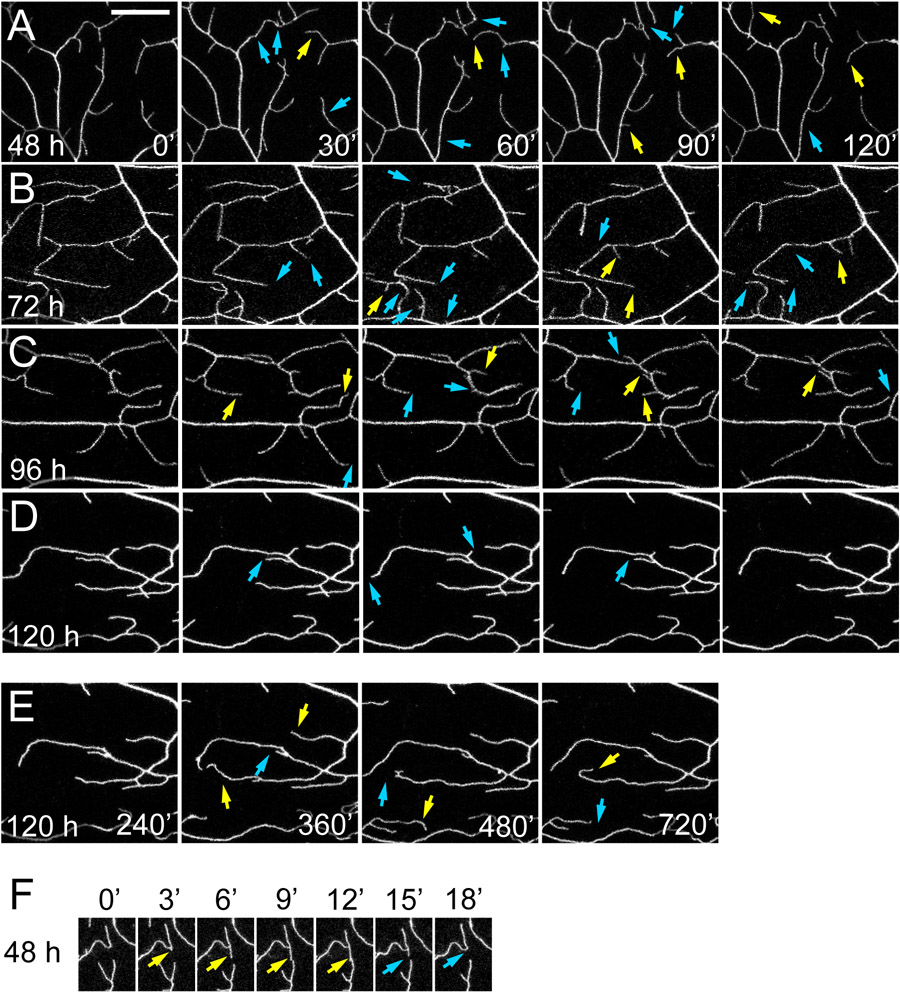
Figure 2: Time-lapse imaging of dendrite dynamics.
(A-F) Selected frames from time-lapse movies of class IV da neuron dendrites at specific time points after the start of imaging. Images of the larvae were taken 48 h AEL (A and F), 72 h AEL (B), 96 h AEL (C), and 120 h AEL (D). The neurons are labeled by ppk>CD4-tdTom (A, D, E, and F) or ppk >CD4-tdTom (B and C). Blue arrows indicate dendrite retractions compared to the previous time point. Yellow arrows indicate dendrite extensions compared to the previous time point. (E) Dendrite morphology at the end of 12 h of imaging. (F) Consecutive frames with 3 min intervals in a movie illustrating how a dendrite branch in a second instar larva extended (yellow arrows) and subsequently retracted (blue arrows) after it made contact with another dendrite.

