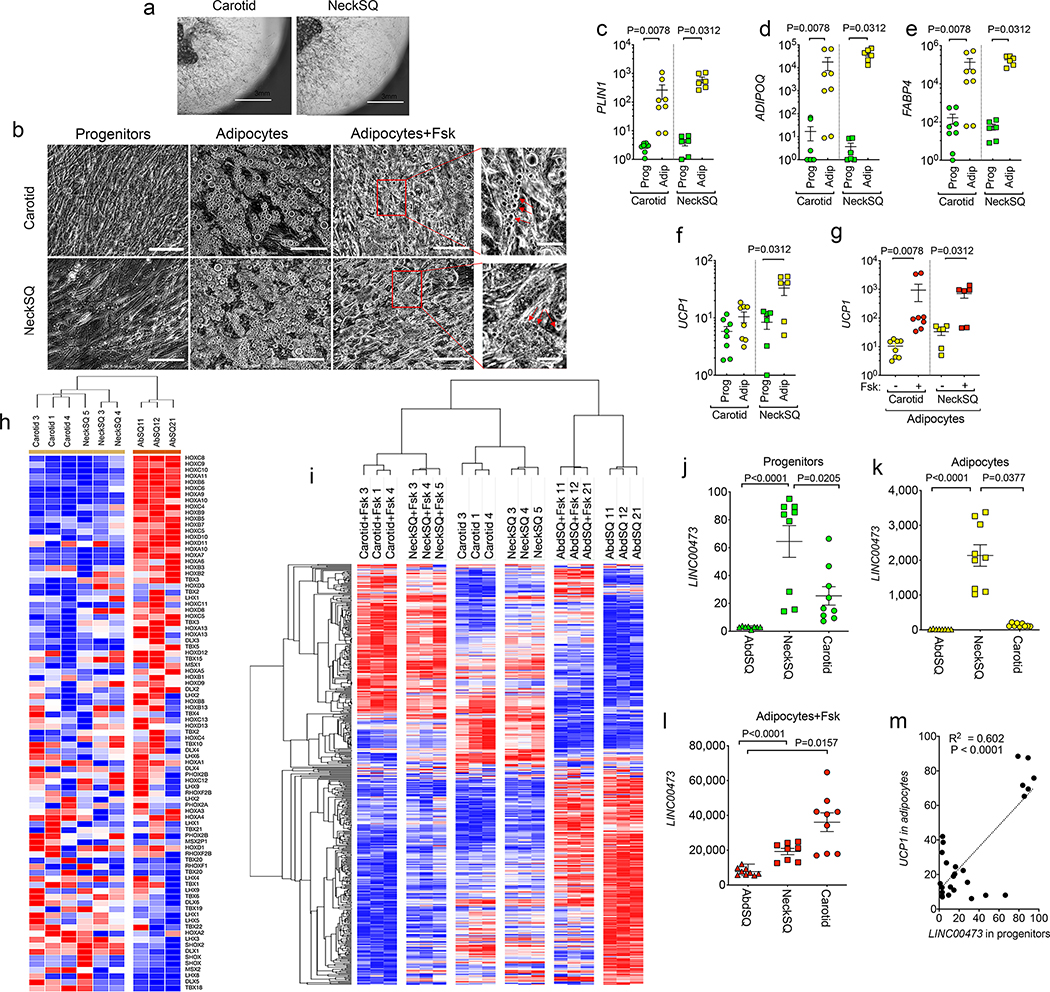
Figure 2. LINC00473 expression is associated with thermogenic adipocyte development.
a. Example of explants from the indicated depots embedded in Matrigel and cultured for 10 days, showing sprouting and proliferation of progenitors. Similar results were seen in n=10 explants from samples from 3 independent individuals. b. Progenitors from Carotid or NeckSQ depots plated on plastic, after differentiation with adipogenic media (adipocytes), and after differentiation and exposure to Fsk daily for the last 5 days in culture (adipocytes+Fsk). Arrowheads in expanded images point to small lipid droplets in cells after Fsk stimulation. Similar results were seen in n=3 cultures from samples from 3 independent individuals. Scale bars=200 μm. c-f. RT-PCR for the genes indicated on the y-axes, from progenitors (Prog) or differentiated adipocytes (Adip) derived from the Carotid or NeckSQ depots as indicated on the x-axis. Values represent the fold-difference over the lowest detected value. Shown are individual values, mean and SEM for n=8 (Carotid progenitors and adipocytes) and n=6 (NeckSQ progenitors and adipocytes) values obtained from 2 independent cultures of cells derived from 3 or 4 different individuals (NeckSQ or Carotid, respectively). g. RT-PCR for UCP1 in adipocytes from Carotid or NeckSQ with or without Fsk stimulation as indicated in the x-axes. Shown are individual values, mean and SEM of n=8 (Carotid adipocytes) and n=6 (NeckSQ adipocytes) biologically independent samples, as described above. For c-g, statistical significance of the differences was calculated using one-way ANOVA corrected for multiple comparisons using the Holm-Sidak method. h. Hierarchical clustering of mean probe intensity values for developmental genes in adipocytes derived from Carotid, NeckSQ and AbdSQ depots from three separate individuals. i. Unsupervised hierarchical clustering of genes showing the largest coefficient of variation (range 0.1 to 0.4) in control and Fsk-treated adipocytes derived from Carotid, NeckSQ and AbdSQ depots from three individuals. j-l. RT-PCR of LINC00473 mRNA in cells derived from the depot indicated in the x-axis. Shown are individual values, means and SEM of n=9 biologically independent cultures derived from 3 different subjects. Statistical differences were calculated using the Krustal-Wallis test for non-parametric distributions, corrected for multiple comparisons using the Dunn’s test. The exact P values are shown. m. Simple linear regression analysis between LINC00473 values in progenitors and UCP1 expression in corresponding adipocytes from cultures from Carotid, NeckSQ and AbdSQ depots, representing n=26 biologically independent samples.

