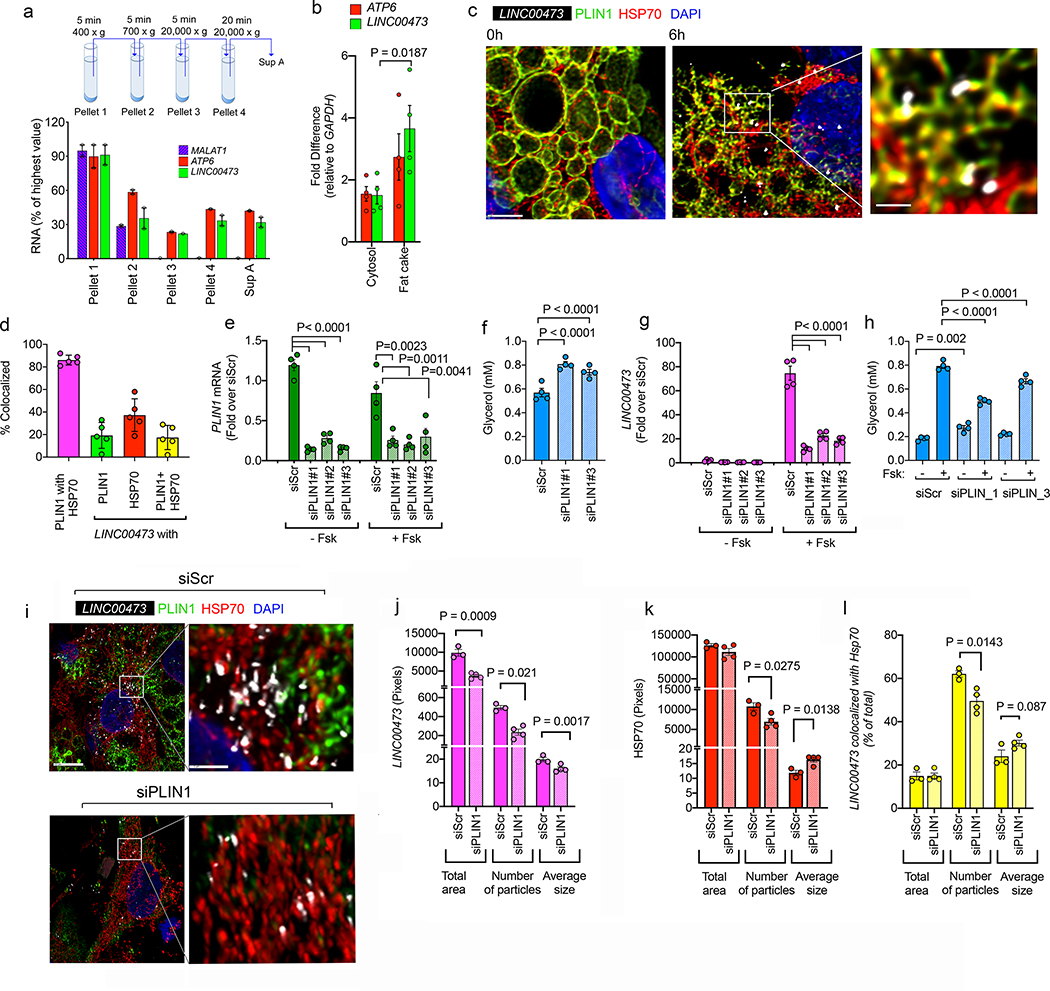
Figure 4.
a Schematic illustration of fractionation protocol, and RT-PCR for MALAT1, ATP6 and LINC00473 in subcellular fractions of adipocytes collected after stimulation with 10 μM Fsk for 6 h. Shown are means and ranges for n=2 independent experiments. b. RT-PCR for ATP6 and LINC00473 in the cytosolic and floating fat fractions. Shown are each value for n=3 independent experiments, and bars represent the means and error lines the SEM. Statistical significance of the difference was calculated using paired, two-tailed student t-tests. c. Maximal intensity projections of confocal stacks of adipocytes stained with antibodies to mitochondrial HSP70 (red) and PLIN1 (green) following in-situ hybridization of LINC00473 (white) in adipocytes stimulated with 10 μM Fsk for 6 h. Scale bars = 5 μm and 1 μm in expanded region. This image is representative of a minimum of 10 independent images from 4 samples prepared from cells from 2 different subjects. d. Extent of co-localization between HSP70, PLIN1 and LINC00473 in adipocytes stimulated with 10 μM Fsk for 6h. Shown are individual values, means and SEM from n=5 independent images. e. RT-PCR of PLIN1 48h after transfection of adipocytes with scrambled (siScr) and three different PLIN1-directed siRNA oligonucleotides (siPLIN1#1–3) and stimulation for 6h with vehicle or 10 μM Fsk. Values are the means and SEM of n=4 independent experiments. f. Glycerol accumulation during 48h after transfection of cells as described in panel (e). Values are the means and SEM of n=4 biological replicates. g. RT-PCR of LINC00473 48h after transfection of adipocytes with scrambled (siScr) and three different PLIN1-directed siRNA oligonucleotides (siPLIN1#1–3) and stimulation for 6h with vehicle or 10 μM Fsk. Values are the means and SEM of n=4 independent experiments. h. Glycerol accumulation in the media during 6h of vehicle or Fsk treatment of cells transfected as described in panel (g). Values are the means and SEM from two independent experiments performed in duplicate wells with no technical replication for glycerol measurement n=4. This experiment has been replicated with cells from a different donor, with similar results. For e, f, g, and h, statistical significance of the differences was estimated using ordinary one-way ANOVA corrected for multiple comparisons using the Holm-Sidak test. i. Maximal intensity projections of confocal stacks of cells stained with antibodies to mitochondrial HSP70 (red) and PLIN1 (green) following in-situ hybridization of LINC00473 (white) in adipocytes transfected with scrambled (siScr) or PLIN1-directed siRNA oligonucleotide (siPLIN1#1), stimulated with 10 μM Fsk for 6h, 48h following transfection. j-l. Image analysis of LINC00473 (j) HSP70 (k), and of areas of LINC00473 and HSP70 co-localization (l). Bars are means and error lines the SEM of n=4 independent fields each for siScr and SiPLIN1, each containing an average of 10 cells. Statistical significance of the differences between Scr and siPLIN1 for each molecule and for each parameter was calculated using un-paired, two-tailed student t-tests.

